Chapter #1: What Is the Statistical Bias?
Hello there! 👋
As promised, I’ll begin this brand new series of posts with a fundamental sub-process of the EDA (i.e. Explanatory Data Analysis) that every aspiring Data Scientist has to face: deal with statistical bias. First of all, we define a dataset as biased when it cannot comprehensively, completely, and accurately represent the underlying problem space. In this kind of dataset, there are more heavily weighted (or represented) instances. This leads to an unbalanced dataset and in the end, it’s more probable to handle with a biased model (believe me, it’s not a great deal 🤕). For example, in a fraud detection problem, fraud occurrences (i.e. positive cases) are likely to be rare and therefore they are not as represented as we wish.
Causes
Statistical bias could be caused by multiple reasons:
- activity bias, when dealing with data extracted from social media content;
- societal bias, when dealing with human-generated content. It’s a superset of the above because it could not be generated only by social media content but also in other ways. All this is due to pre-concepts and notions already present in society;
- selection bias, when dealing with a ML system that improve itself by asking human feedbacks, which are used to improve the model performance. For instance: the streaming service recommendation system is constantly improved by users;
- data drift, which I will better explain in a different post.
Measuring statistical bias
Which metrics could you use to measure statistical bias? Well, you may take advantage of the following ones:
- Class imbalance (CI): for instance, let’s consider a product reviews dataset. CI answers the question “does a product category have disproportionately more instances than others?”;
- Difference in Proportions of Labels (DPL): measures the imbalance of positive outcomes between different facet values. In the same example as before, it answers the question “does a product category has disproportionately higher ratings than others?”.
Tools
Data bias could be detected with many different tools but since I use AWS I’ll take advantage of SageMaker sub-tools.
SageMaker Data Wrangler
First, I will introduce Data Wrangler. Data Wrangler provides you with capabilities to connect to different data sources. You can then visualize, apply any number of transformations and detected for your data, visualize the data, and transform the data, by applying any number of transformations, detected statistical bias in your data sets, and generate reports about it. Although it can be used for feature importance as well, in this post I’ll mainly put my focus on statistical bias detection and generated reports on the training set.
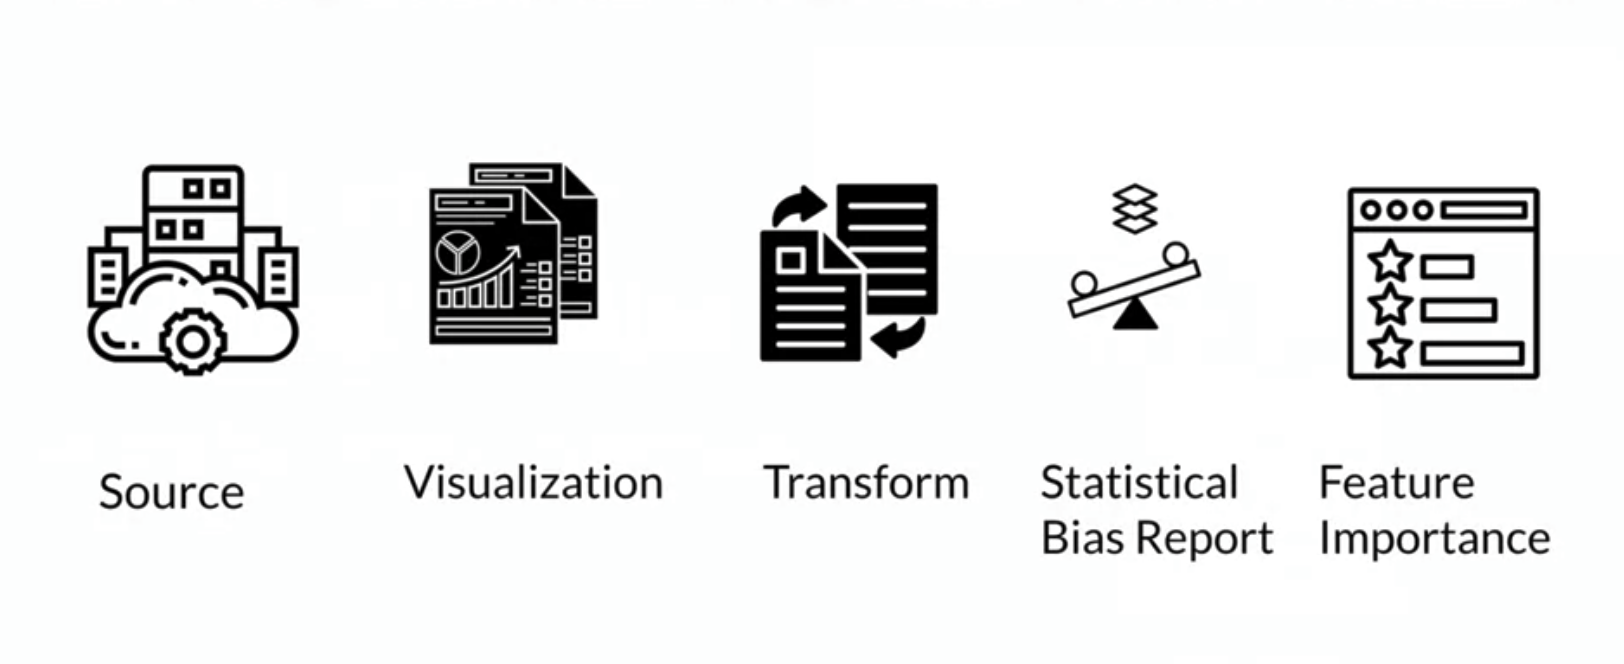
SageMaker Data Wrangler capabilities
Sagemaker Clarify
The second tool is Amazon SageMaker Clarify, a tool to perform statistical bias detection on your datasets. SageMaker Clarify can perform statistical bias detection and generate bias reports on your training datasets. Additionally, it can also perform bias detection in trained and deployed models. It further provides capabilities for machine learning explainability, as well as detecting drift in data and models. For now, I’m going to focus on the statistical bias detection and report generation capabilities of Clarify.
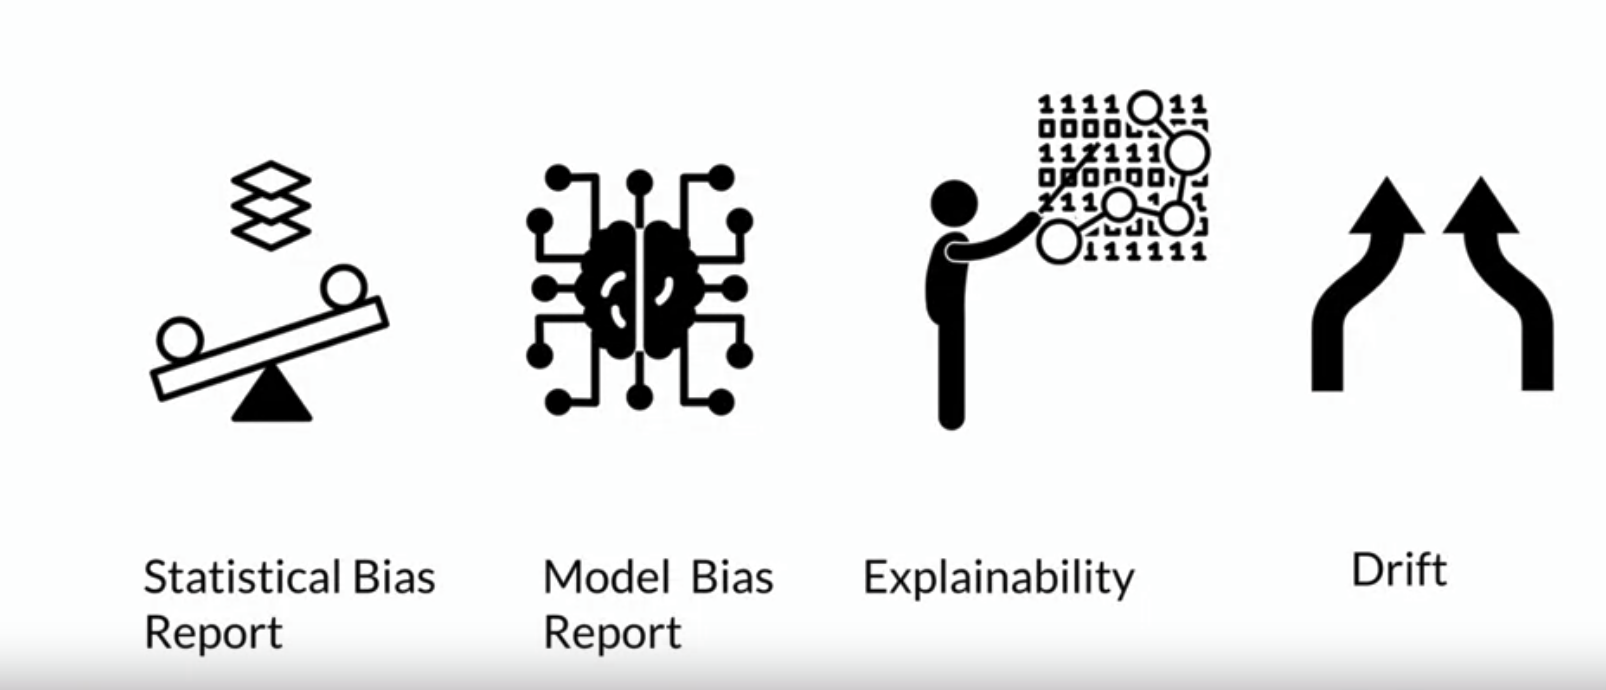
SageMaker Data Clarify capabilities
To start using Clarify, let’s use the following code as a template.
Code snippet #1
from sagemaker import clarify

clarify_processor = clarify.SageMakerClarifyProcessor(
    role=role,
    instance_count=1,
    instance_type='ml.c5.2xlarge',
    sagemaker_session=sess
)

bias_report_output_path = << Define S3 path >>
Explanation
As you could have imaged reading the previous code snippet, the goal is to set up a distributed cluster to scale up your bias detection process if needed.
To achieve this, let’s import the Clarify library from the SageMaker SDK. Once you have the Clarify library, construct the object, SageMaker Clarify Processor using the library. By using two parameters, instance type and instance count, you can scale up the distributed cluster to the capacity that you need. The instant count represents the number of nodes that are included in the cluster, and the instance type represents the processing capacity of each node in the cluster. The processing capacity is measured by the node’s compute capacity, memory, and network capabilities. Once you have configured the distributor cluster, next, you specify an S3 location, where you want the bias report to be saved. That’s the parameter bias_report_output_path.
Code snippet #2
bias_data_config = clarify.DataConfig(
    s3_data_input_path=...,
    s3_output_path=...,
    label='sentiment',
    headers=df_balanced.columns.to_list(),
    dataset_type='text/csv'
)
Explanation
Once this step is done, the next step is to configure the data config object on the Clarify library. The data config object represents the details of your data. So as you can expect, it has the input and output location of your data, in S3, as well as the label that you’re trying to predict, using that dataset. In this case here, the label that we are trying to predict is sentiment.
Code snippet #2
bias_config = clarify.BiasConfig(
    label_values_or_threshold=[...],
    facet_name='product_category'
)
Explanation
Next, you configure the bias config object on Clarify library. The bias config object captures the facet or the featured name that you are trying to evaluate for bias or imbalances. In this case, you’re trying to find out imbalances in the product_category feature. The parameter label_values_or_threshold defines the desired values for the labels.
Code snippet #3
clarify_processor.run_pre_training_bias(
    data_config=...,
    data_bias_config=...,
    methods=['CI', 'DPL',...],
    wait=<<False/True>>
    logs=<<False/True>>
)
Explanation
Once you have configured those three objects, you are ready to run the pre-training bias method on the Clarify processor. In addition to specifying the data config and the data bias config that you already configured, you can also specify the methods that you want to evaluate for bias. So, these methods are the metrics that you’ve already learned about to detect bias. The metrics here are the CI (i.e. the class imbalance), and the DPL (i.e. Difference in Proportions of Labels ). You can specify a few other methods here as well. The wait parameter specifies whether this bias detection job should block the rest of your code or should be executed in the background. Similarly, the logs parameter specifies whether you want to capture the logs or not. Once the configuration of the pre-training bias method is done, you launch this job.
In the background
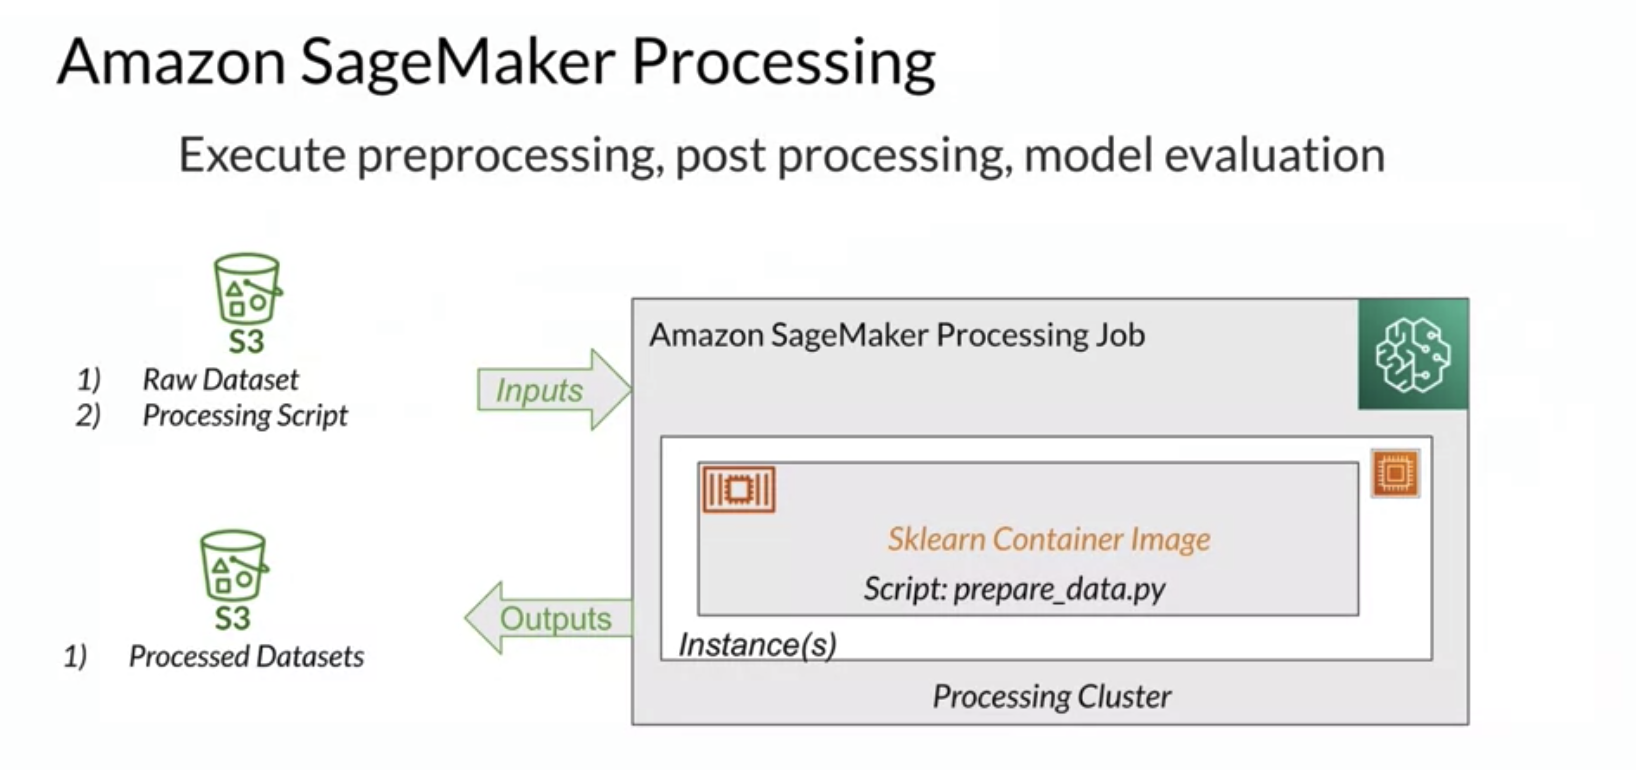
SageMaker Processing
In the background, SageMaker Clarify is using a construct called SageMaker Processing Job, which is a construct that allows you to perform any data-related tasks (e.g. pre-processing, post-processing, model evaluation, etc) at scale. The data is collected from the S3 bucket and then processed on this processing cluster which contains a variety of containers. By default, there are built-in containers for Sklearn, Python, and a few others that are supported. You can bring your custom container as well. Once the processing cluster has processed the data, the transformed data is put back in the S3 bucket.
Briefly, the result of a pre-training bias will be a very detailed report on your dataset bias: you can also download it!
Which one of these tools should I use?
The first option, Data Wrangler, provides you with more of a UI-based visual experience.
On the other hand, SageMaker Clarify provides you with more of an API-based approach. Additionally, Clarify also provides you with the ability to scale out the bias detection process. SageMaker Clarify uses a construct called processing jobs that allow you to configure a distributed cluster to execute your bias detection job at scale.
Additional material
If you’d like to gain more information about measuring pretraing bias let’s have a look at AWS documentation.
So, that’s it for this post. I will write another short one as a tutorial on how to practically use SageMaker Clarify.