Chapter #3: Feature Importance on SageMaker Data Wrangler
Hi folks! 👋
In this post, I will explain to you how to use Data Wrangler to calculate feature importance on your data set. To get started, I choose to start a new data flow from the Amazon SageMaker Studio homepage.
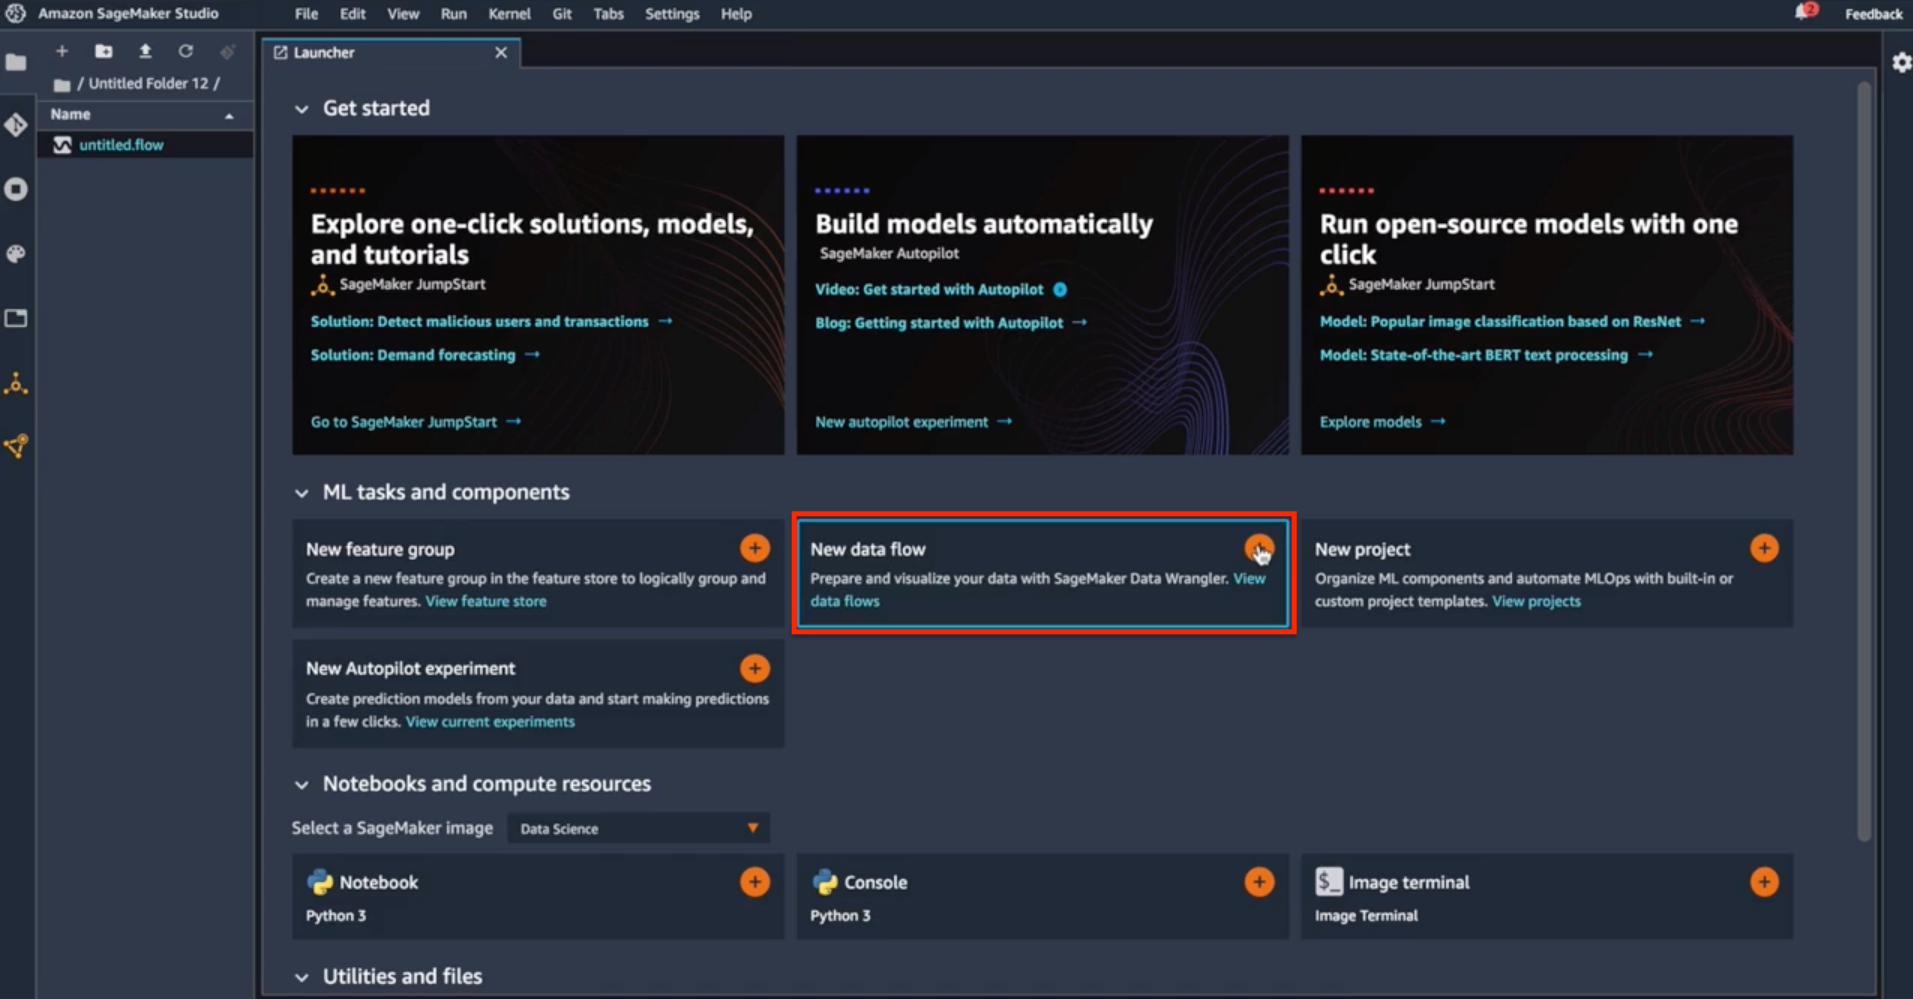
New data flow
Here I have a chance to get connected to data from multiple sources, such as Amazon S3 and Amazon Athena. For my case, I have all of my data in S3, so let me go ahead and navigate to S3.
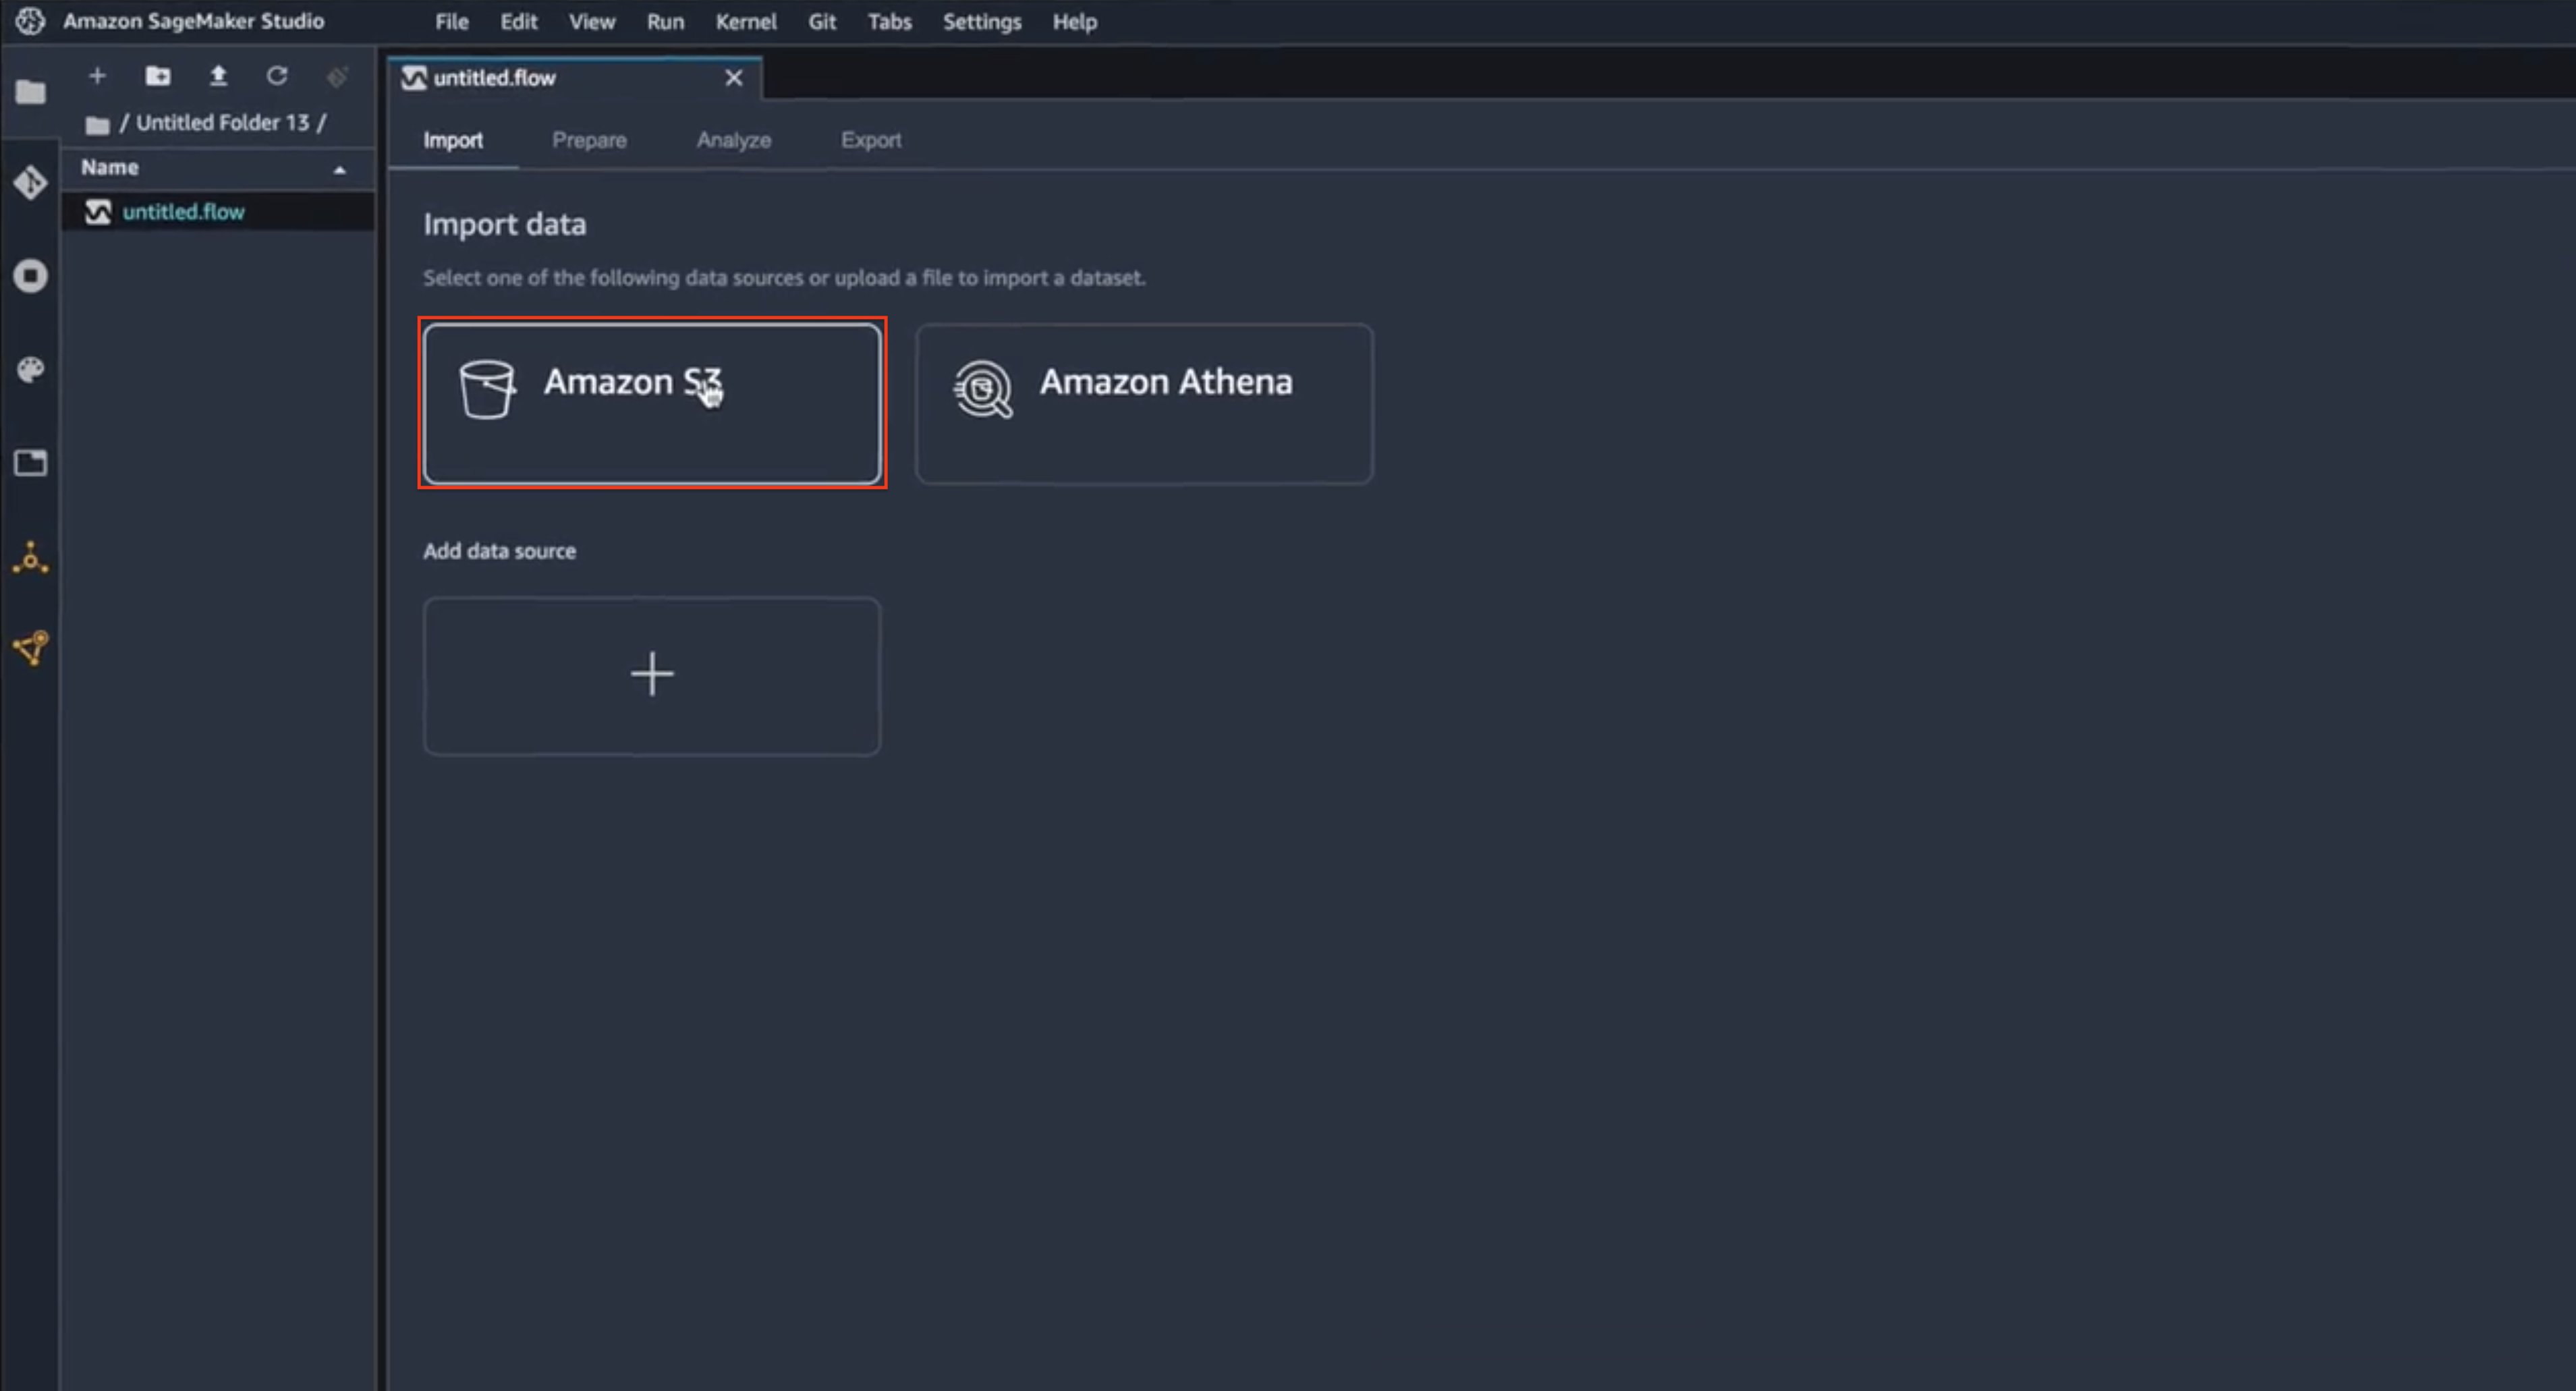
Source type selection
Now I have to find the right bucket and look at the data that I want to calculate the feature importance.
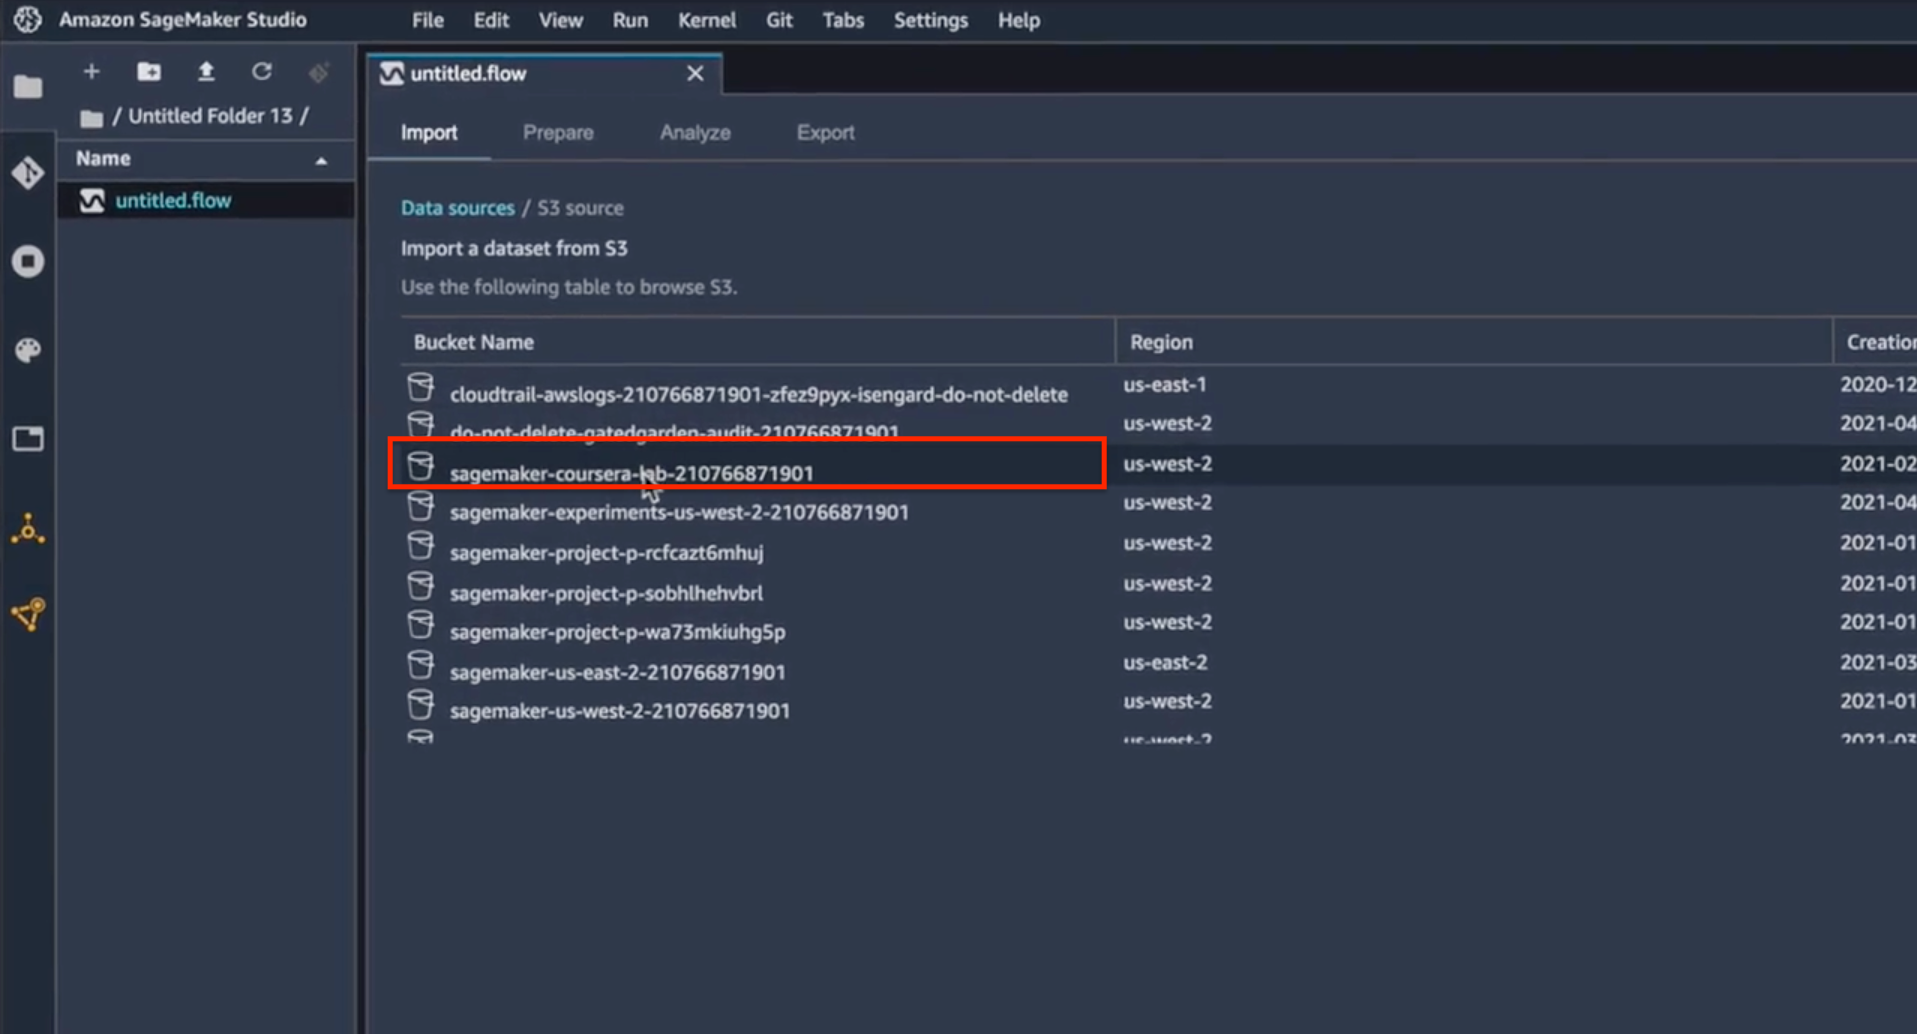
S3 bucket selection
I’m going to use my raw data set of the product reviews (saved as a CSV file), to calculate the feature importance. When I select the right CSV, I get a little preview of the features that are included in that CSV file.
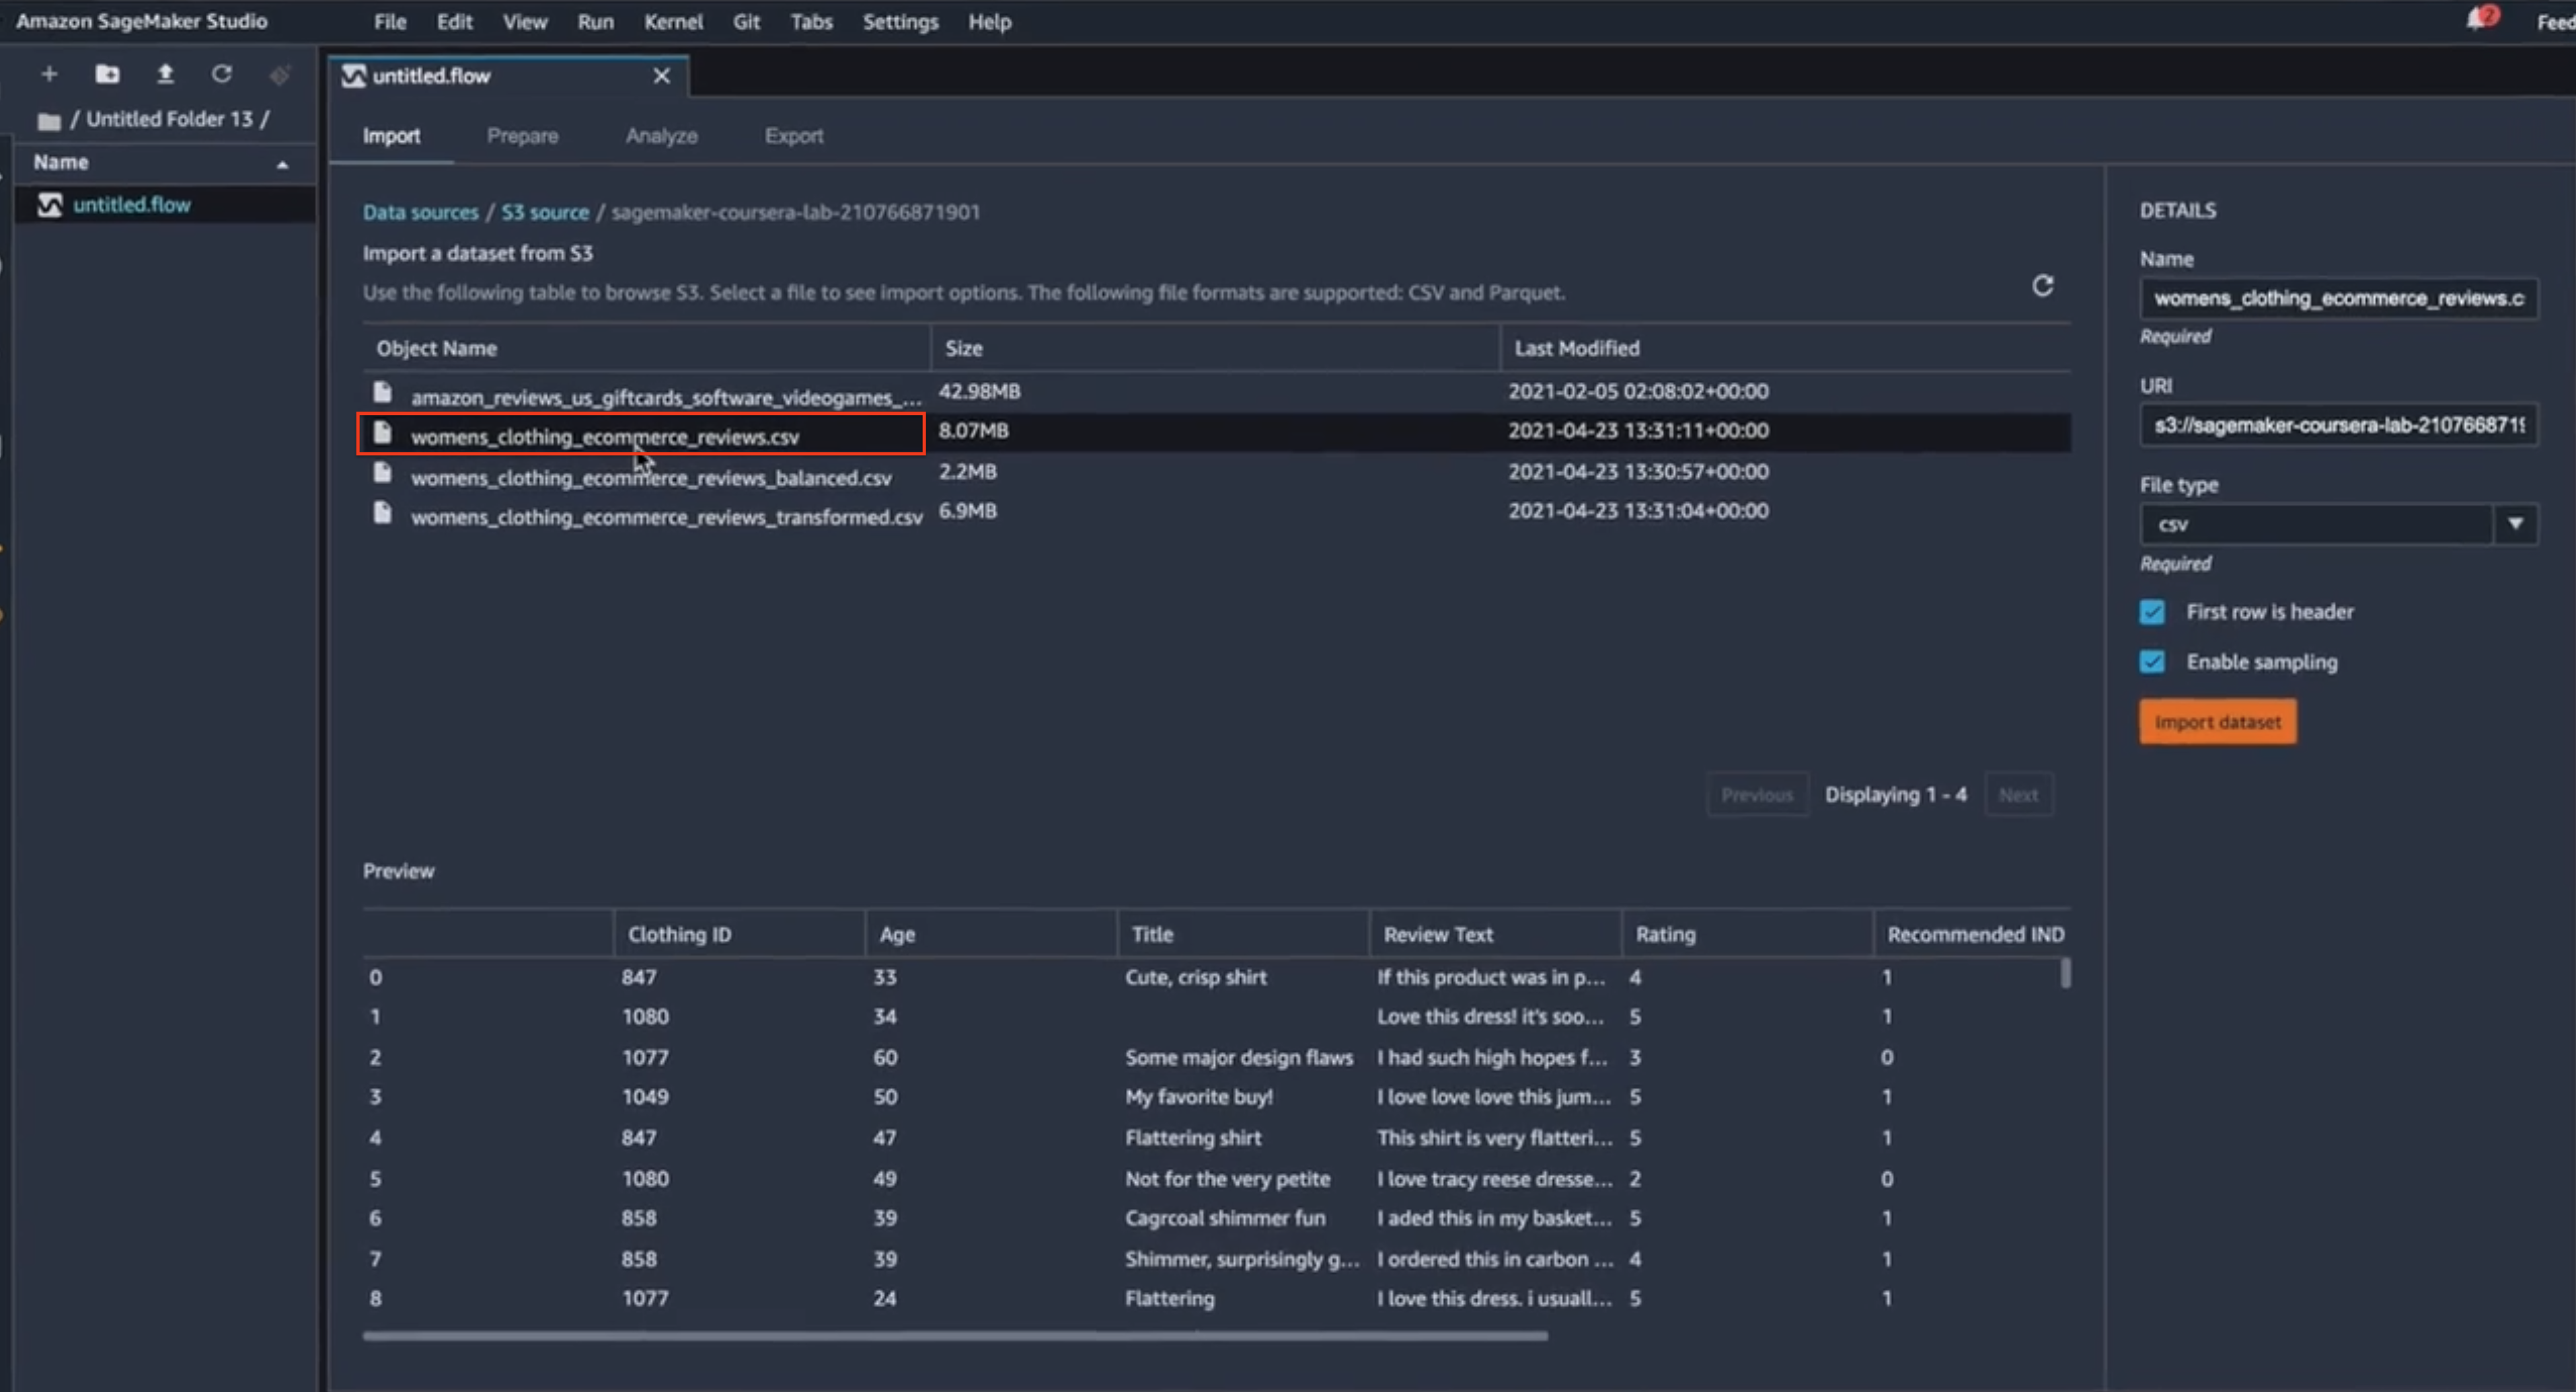
CSV selection
Once I took a quick review of the fields that are included here and I’m enough satisfied with this data, I can just simply import the data set.
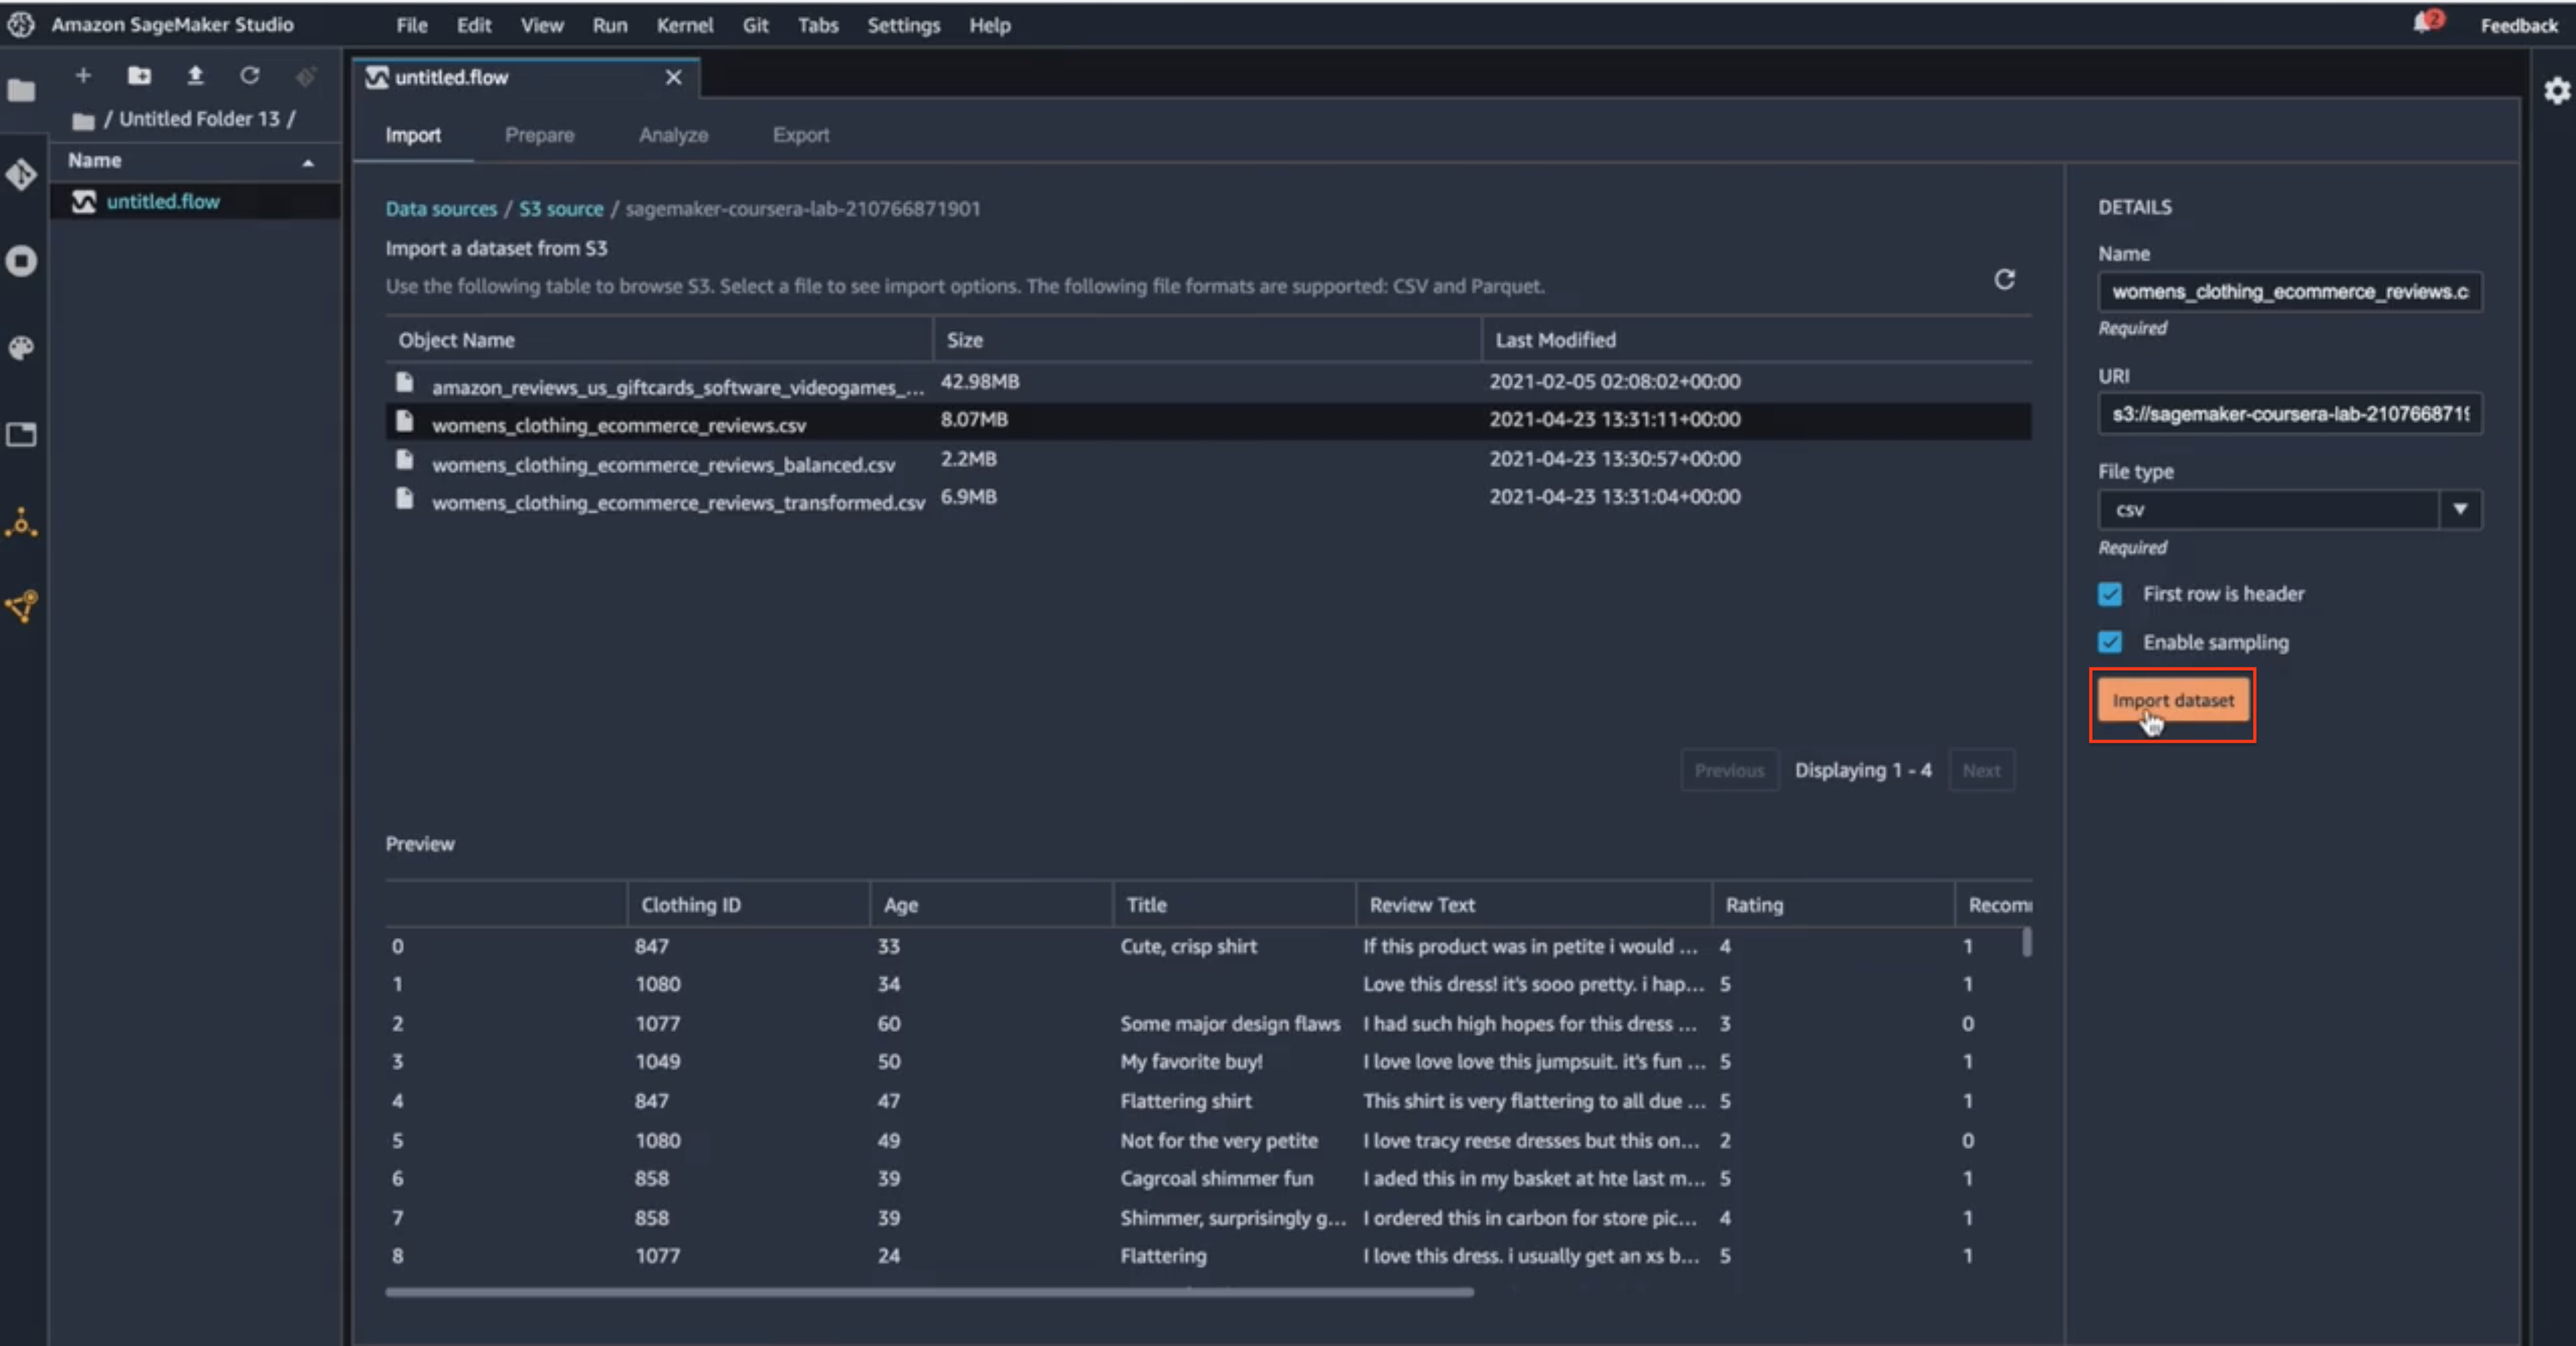
Import dataset
That action will bring the data from the S3 bucket into the Data Wrangler environment. And once that data is imported, if I click on this plus sign here, I will see that there are different operations that I can take to act on the data. For this blog’s purposes, I’m going to add analysis to that data.
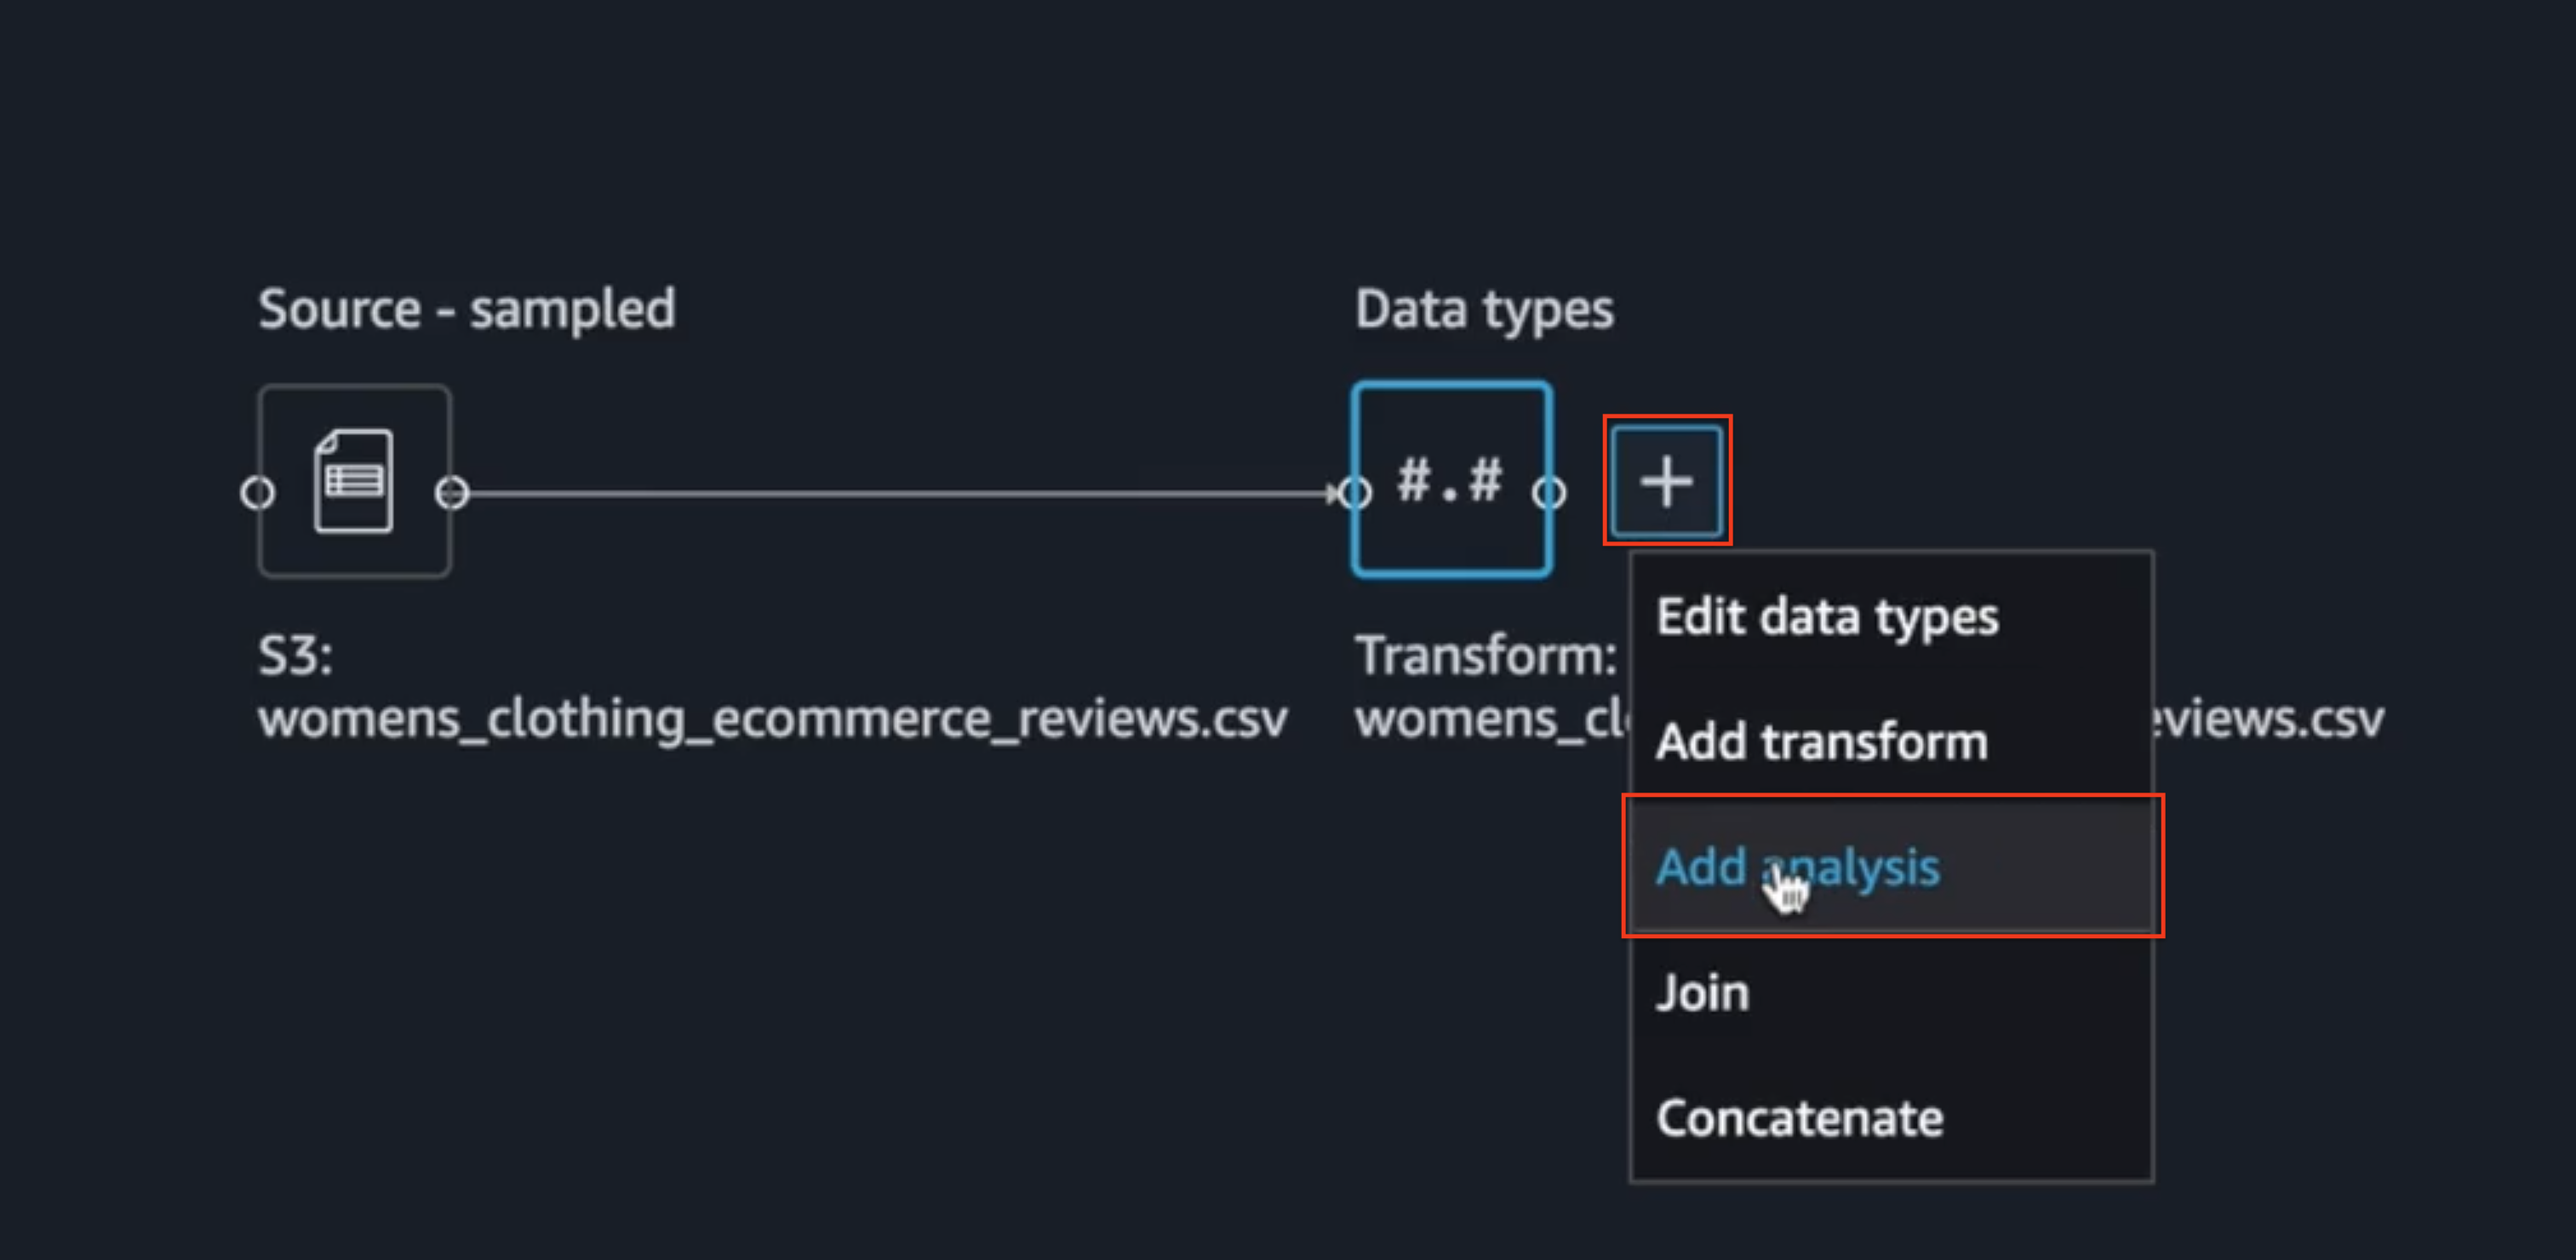
Data analysis
When I arrive at this page, I will select what type of analysis I want to do. Here I’ll see that I have an option of doing multiple types of analysis. I will select the Quick Model because that’s going to give me the feature importance calculation on the data set and I will name my analysis as FI. And I will set the label that I want to indicate in my data set. Because I’m using the raw data set here, I don’t have the sentiment feature yet in this data set, but I’ll see that the sentiment column is derived from star rating. So, I will use the star rating as the label for this analysis. Once I do this quick configuration here, I can do a preview of what the analysis will look like.
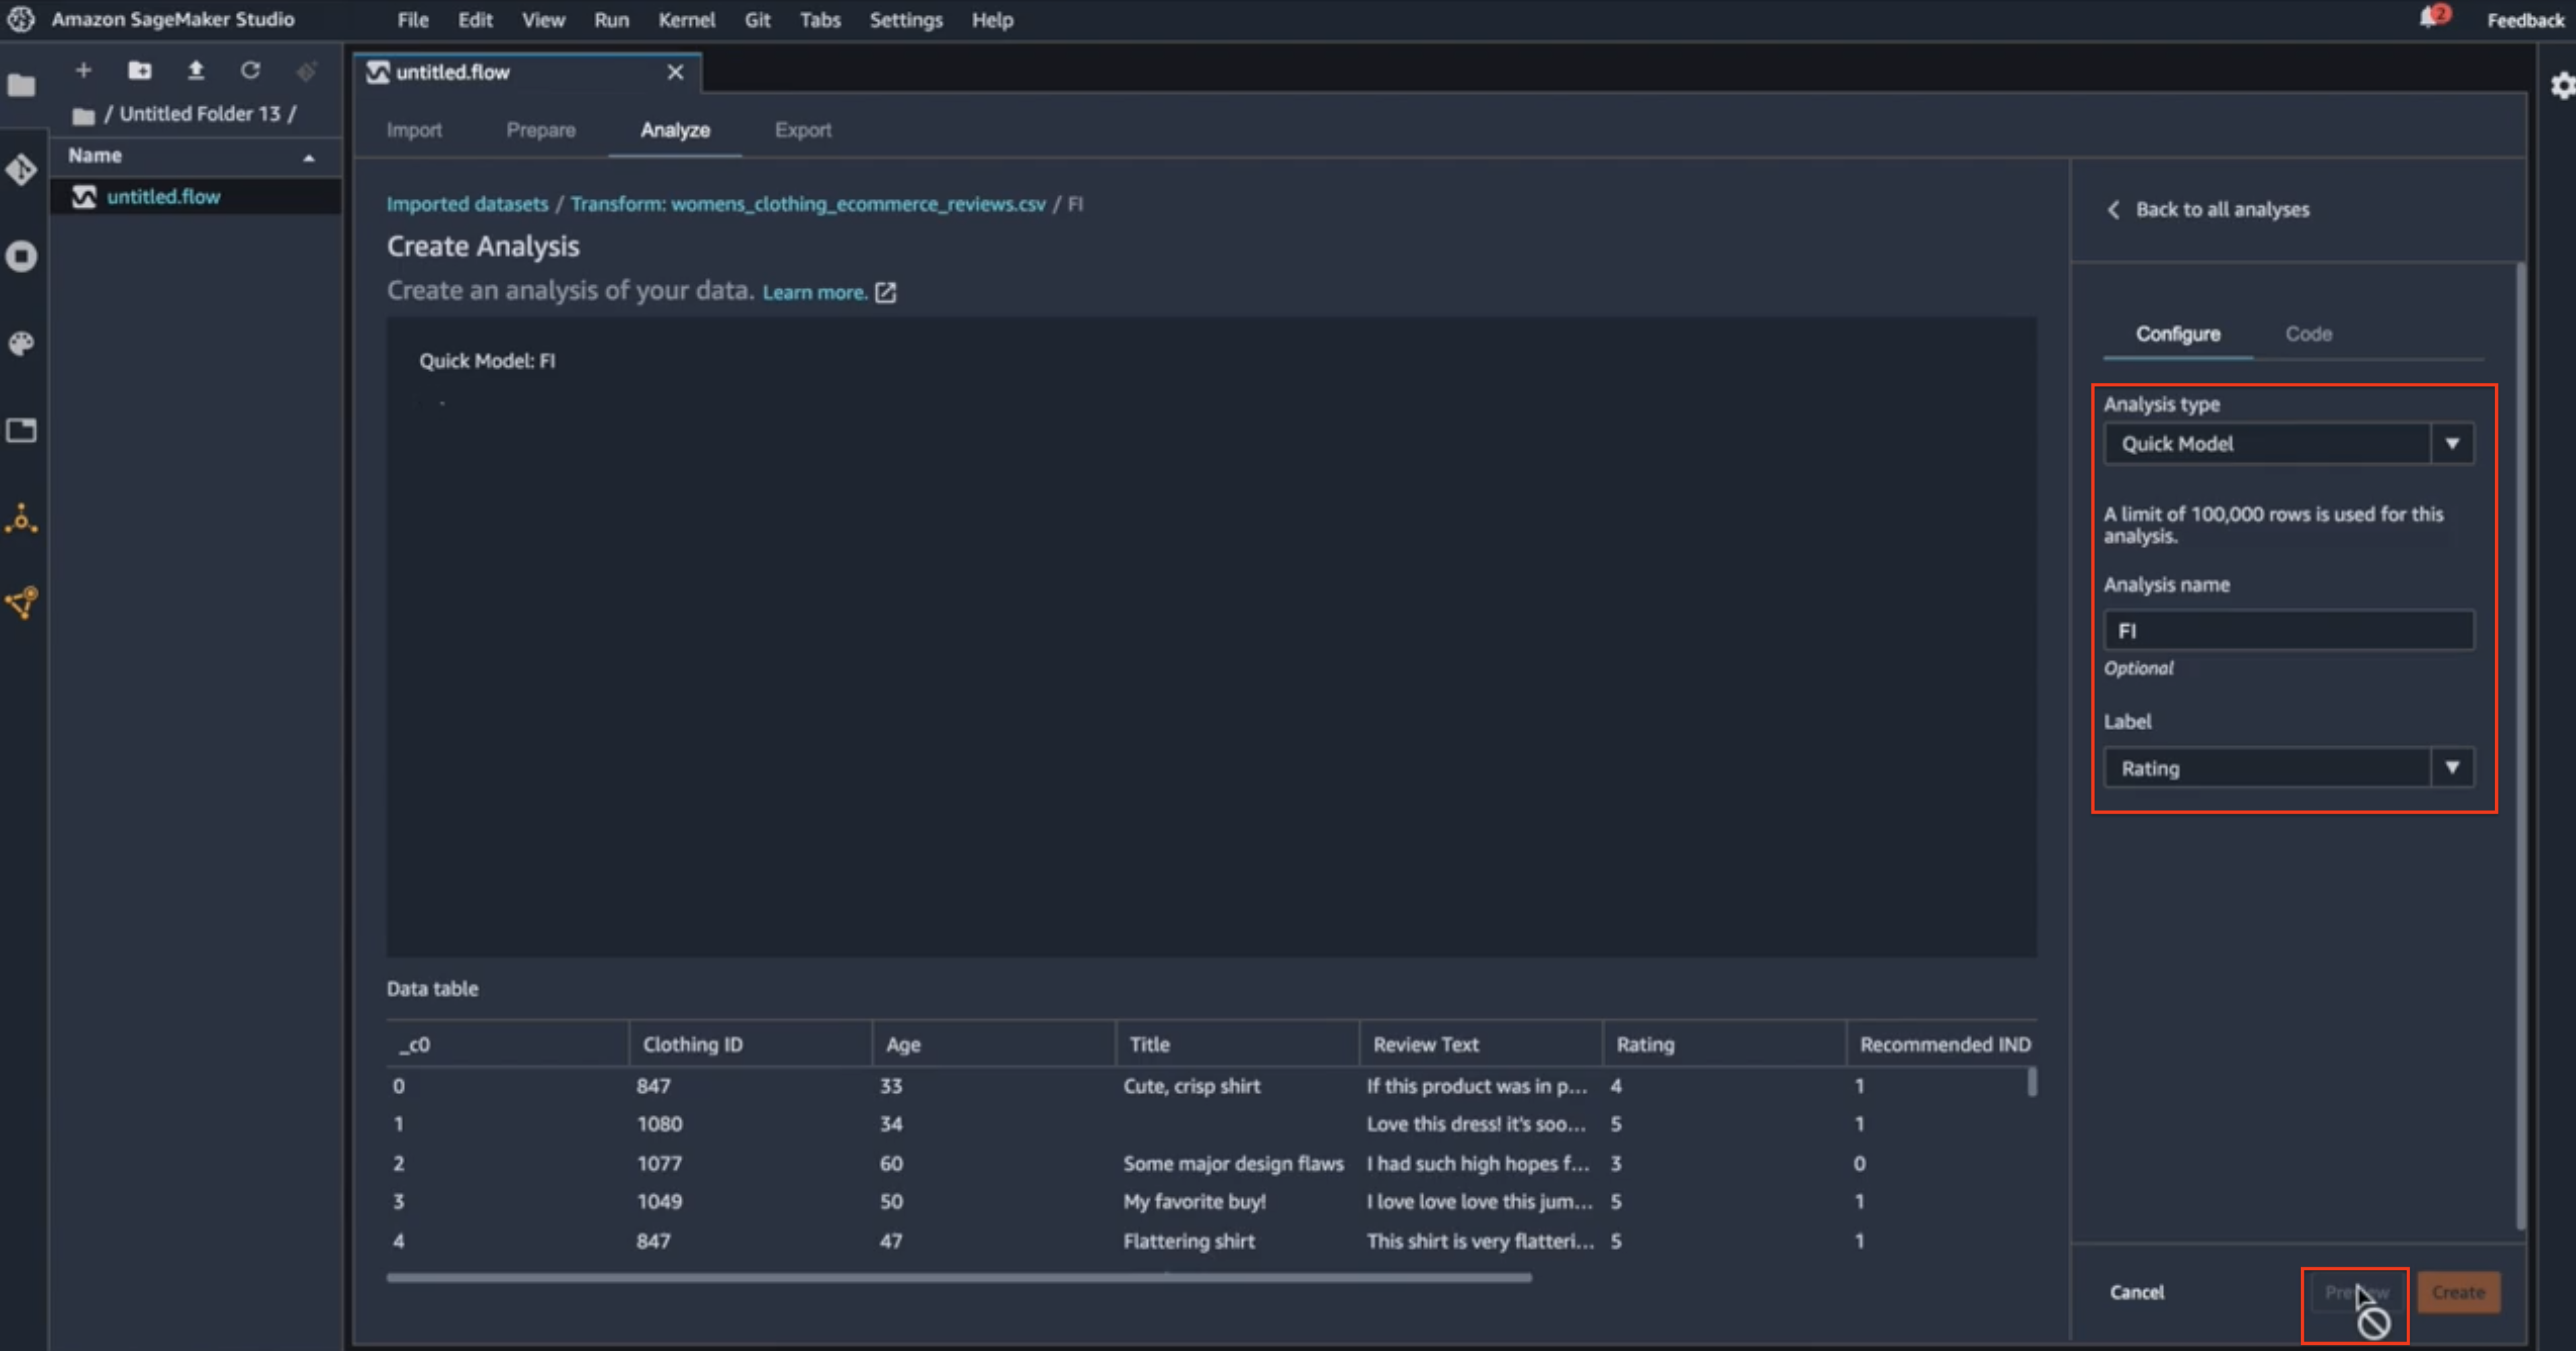
Analysis tipe
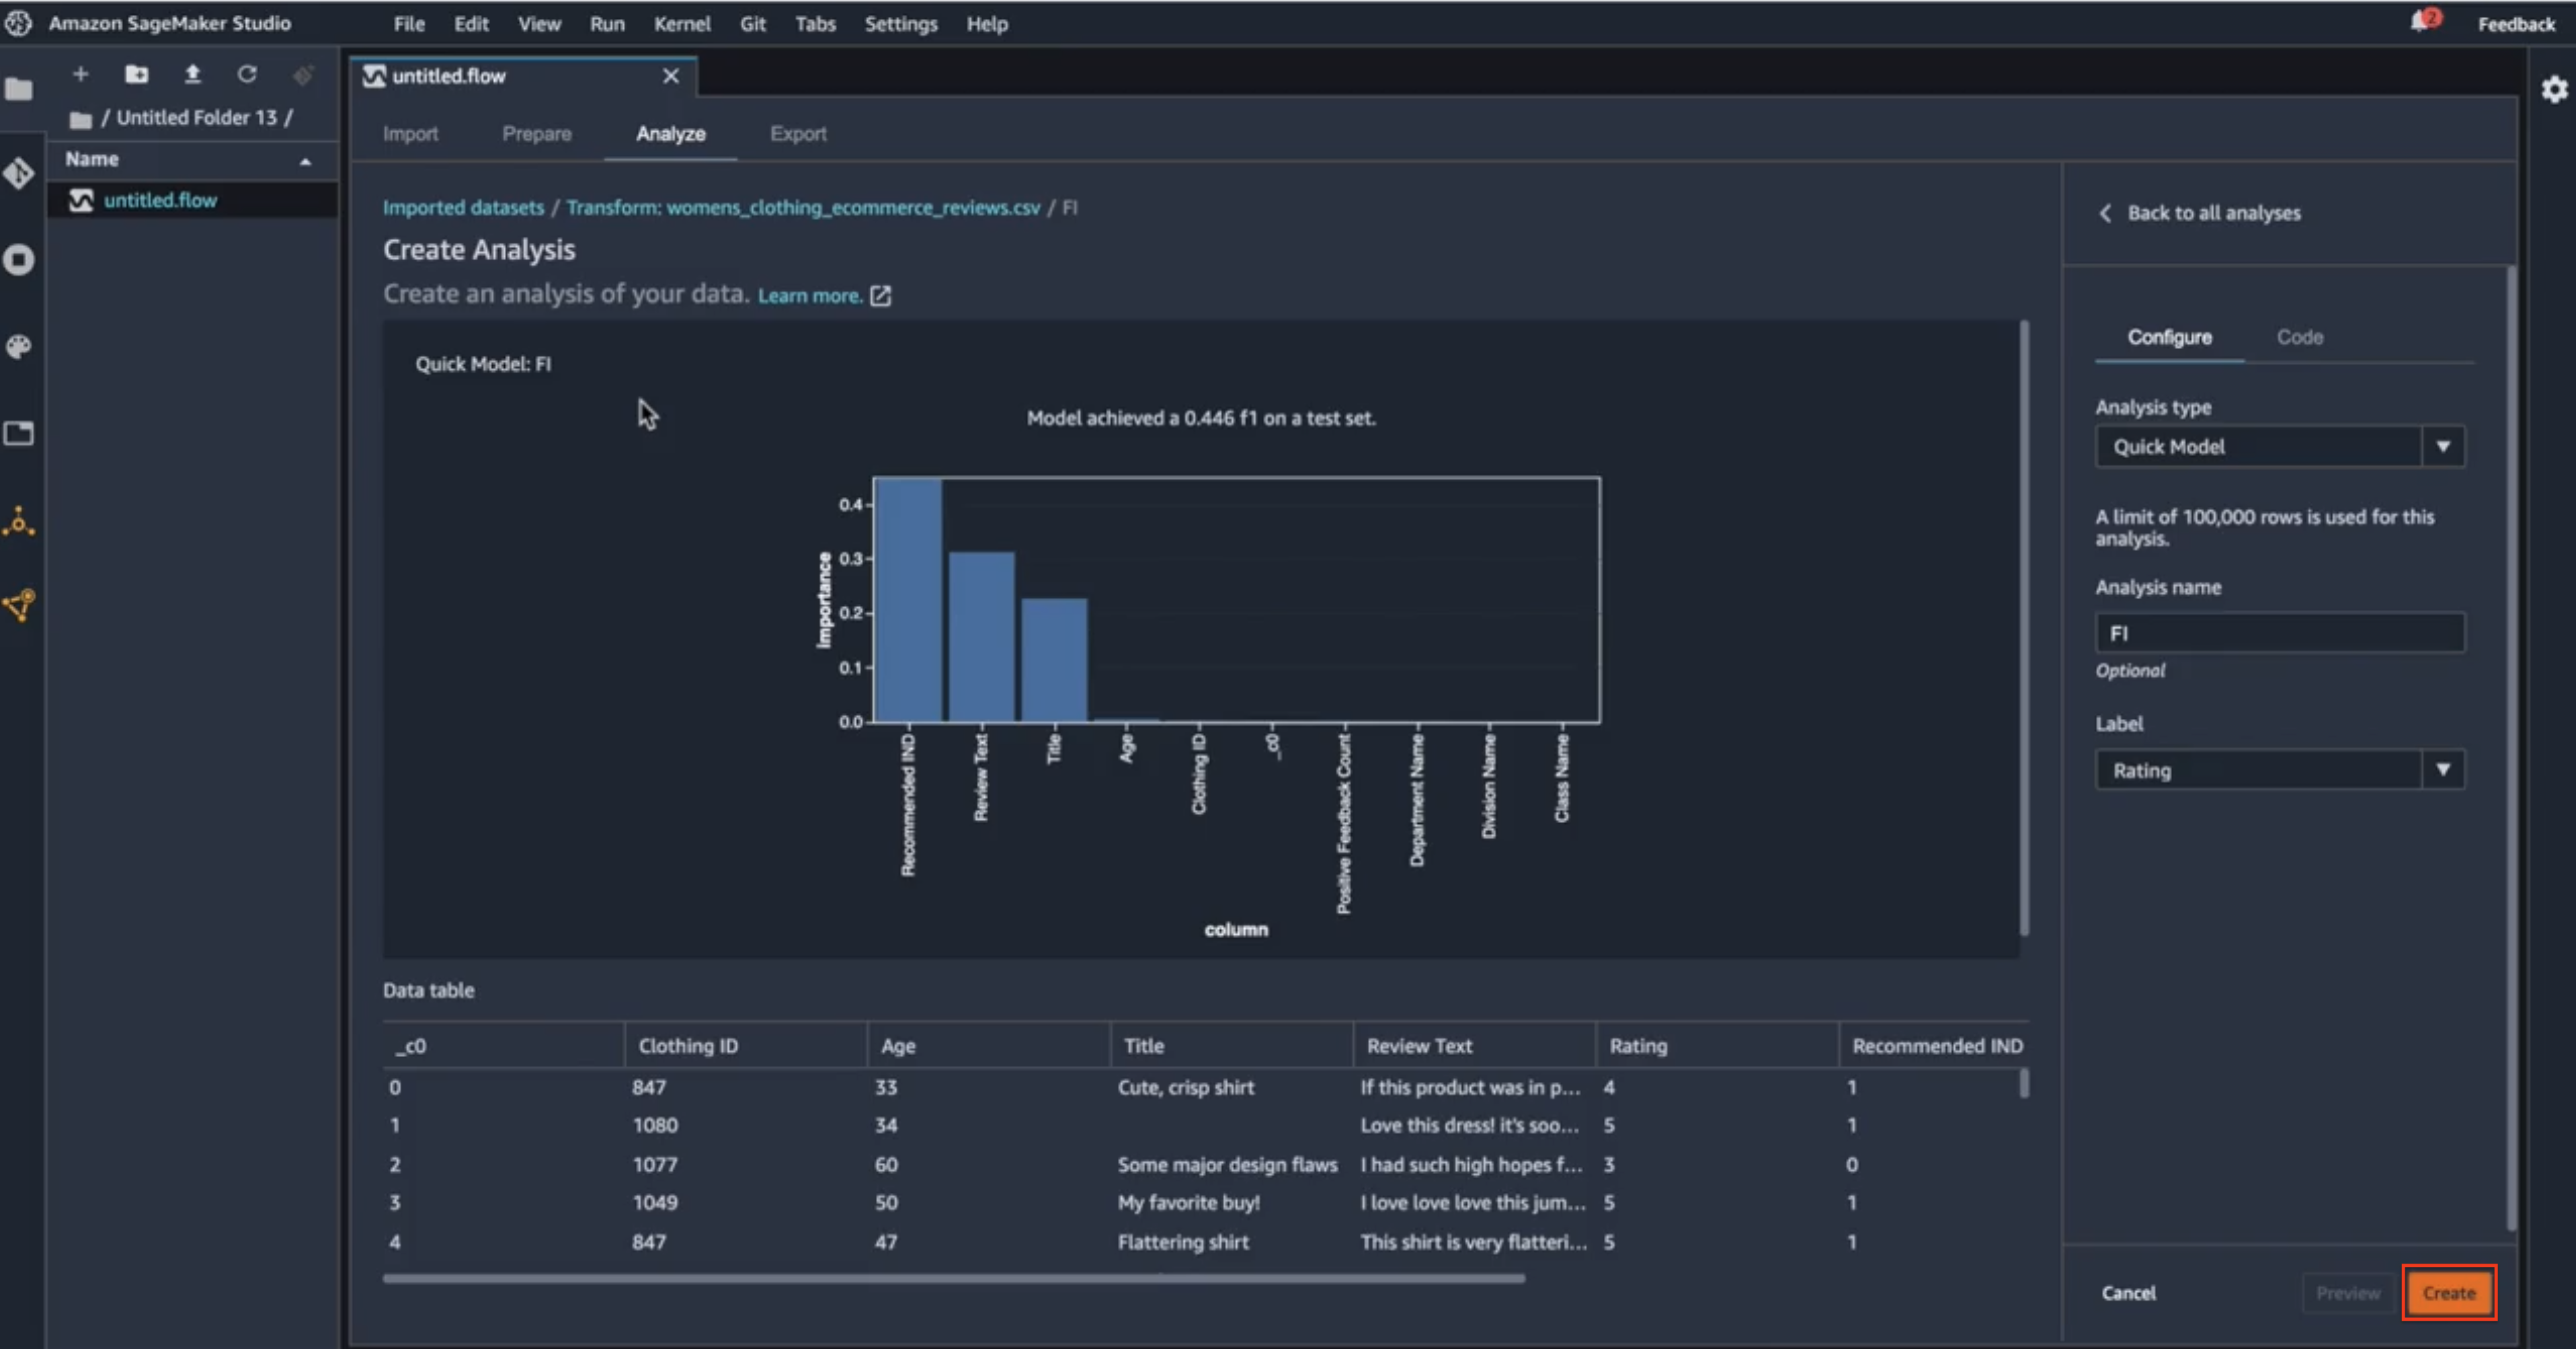
When I hit that preview, Data Wrangler is working in the background to create a quick model out of a subset of my data. It uses 70% of the subset of the data for training and 30% for test. It will build that quick model to analyze the F1 score of that quick model. Here, Data Wrangler has calculated the feature importance score on my data set. Behind the scene, Data Wrangler ran a Random Cut Forest algorithm on the subset of my data, using 70% for training and 30% for testing. And it has calculated a quick model to give me the feature importance scores, as well as the F1 score. So, I can see the F1 score on the quick model that was built on the data. Now, let’s look at what’s included in this feature importance scores here.
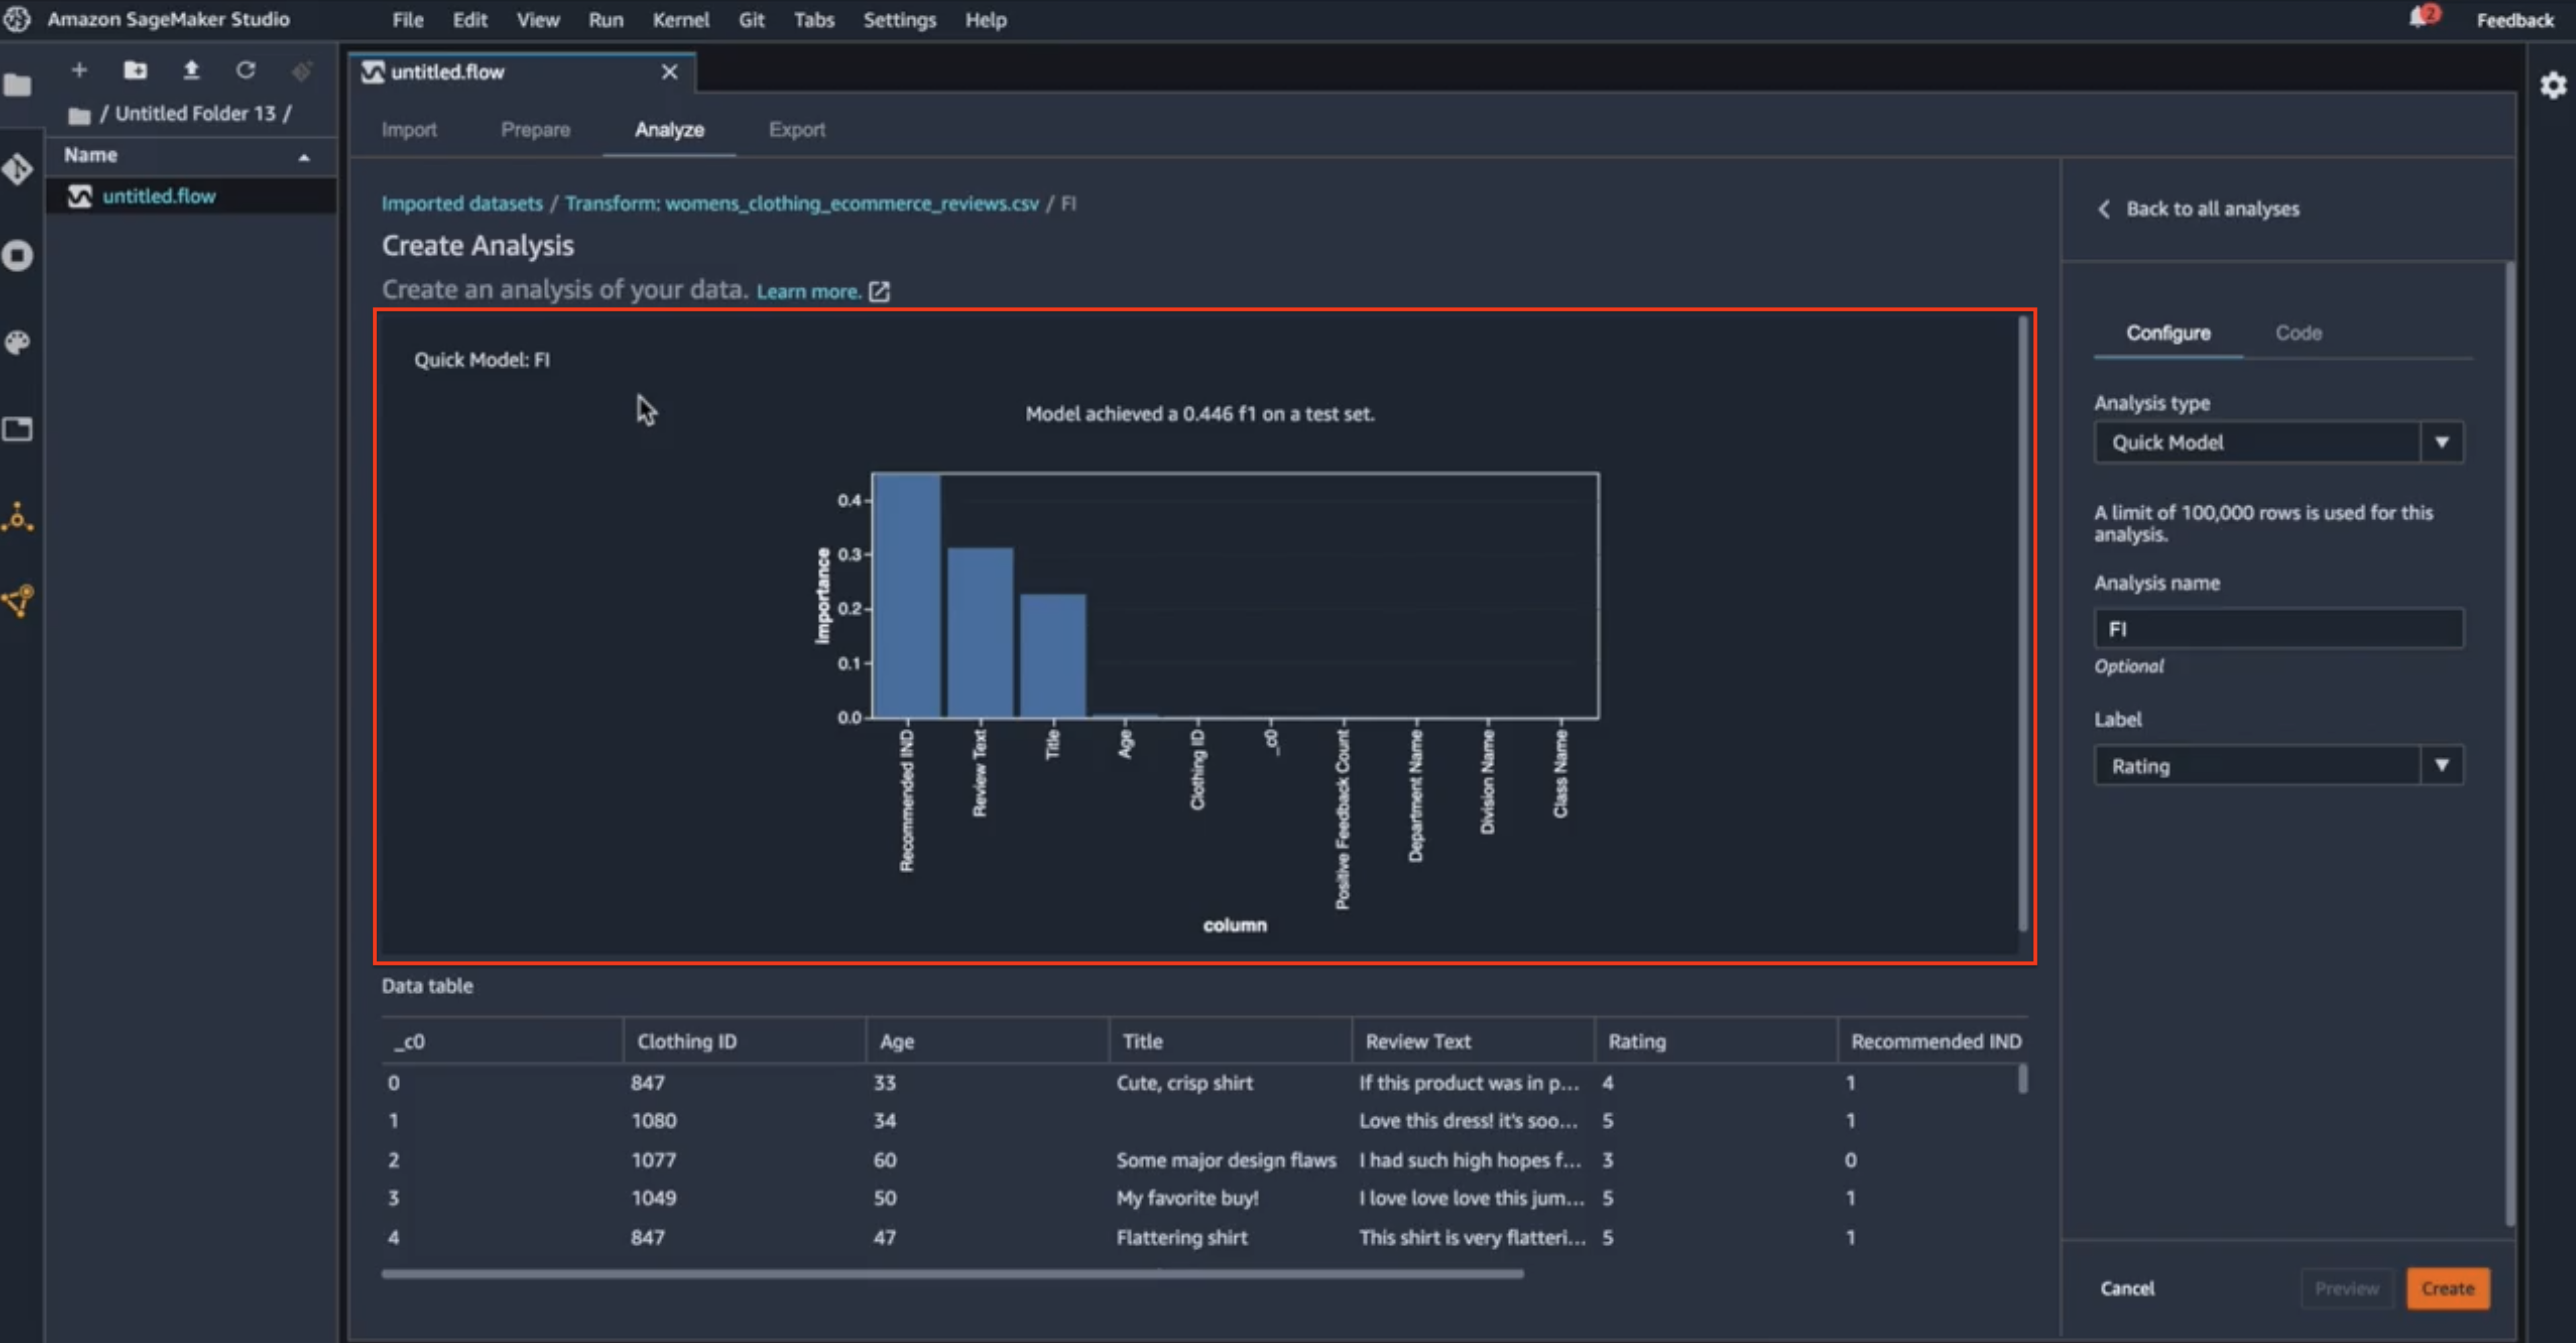
Data analysis preview
So here I can see that three of the features in the data set are contributing to the final model, as indicated by the importance score. The highest-ranking one is the recommended indicator, recall that this is the feature that indicates whether the reviewer is recommending this particular product to others or not. This intuitively makes sense: if a particular reviewer is recommending the product to others, then we can intuitively say that the star rating for that product is going to be higher. Similarly, I can see that the review text and the review title are also contributing to the final model. That also makes sense: if I have a review like “This product is really good, I really enjoy it.” vs “This product is not good at all, I’m sorry I wasted my time on this.” I can see how that review text can affect the star ratings of the product. On the other hand, if I look at the right-hand side of this corner, I will find some columns, the class name, the division name, and so on, that are not contributing to the final model at all. Now, what’s surprising here to me is this positive feedback count. I would think the positive feedback count will contribute to my final model when it’s trying to credit the star rating of a product, but this is just a starting point here. So, after I saw this feature importance, maybe I have an opportunity to go back and fix the data set and perform more feature engineering tasks, like dropping some of the non-contributing columns, hence I can reduce the dimensions of the training data set. There is also an opportunity to combine fields, maybe combining the positive feedback count and the recommended indicator, to arrive at a new feature that could improve the F1 score or the final model itself. So, based on what the feature importance score is showing me, U can go back and do more feature engineering tasks on my data set. Now that I have had a chance to look through the F1 scores and did a little bit of analysis, I will go ahead and create the entire analysis here.
Create persistent data analysis
And the reason for creating this new analysis here is that the next time I want to look at the data and F1 scores, I don’t have to start from scratch. I can simply use this persistent analysis and get back to this screen right here.
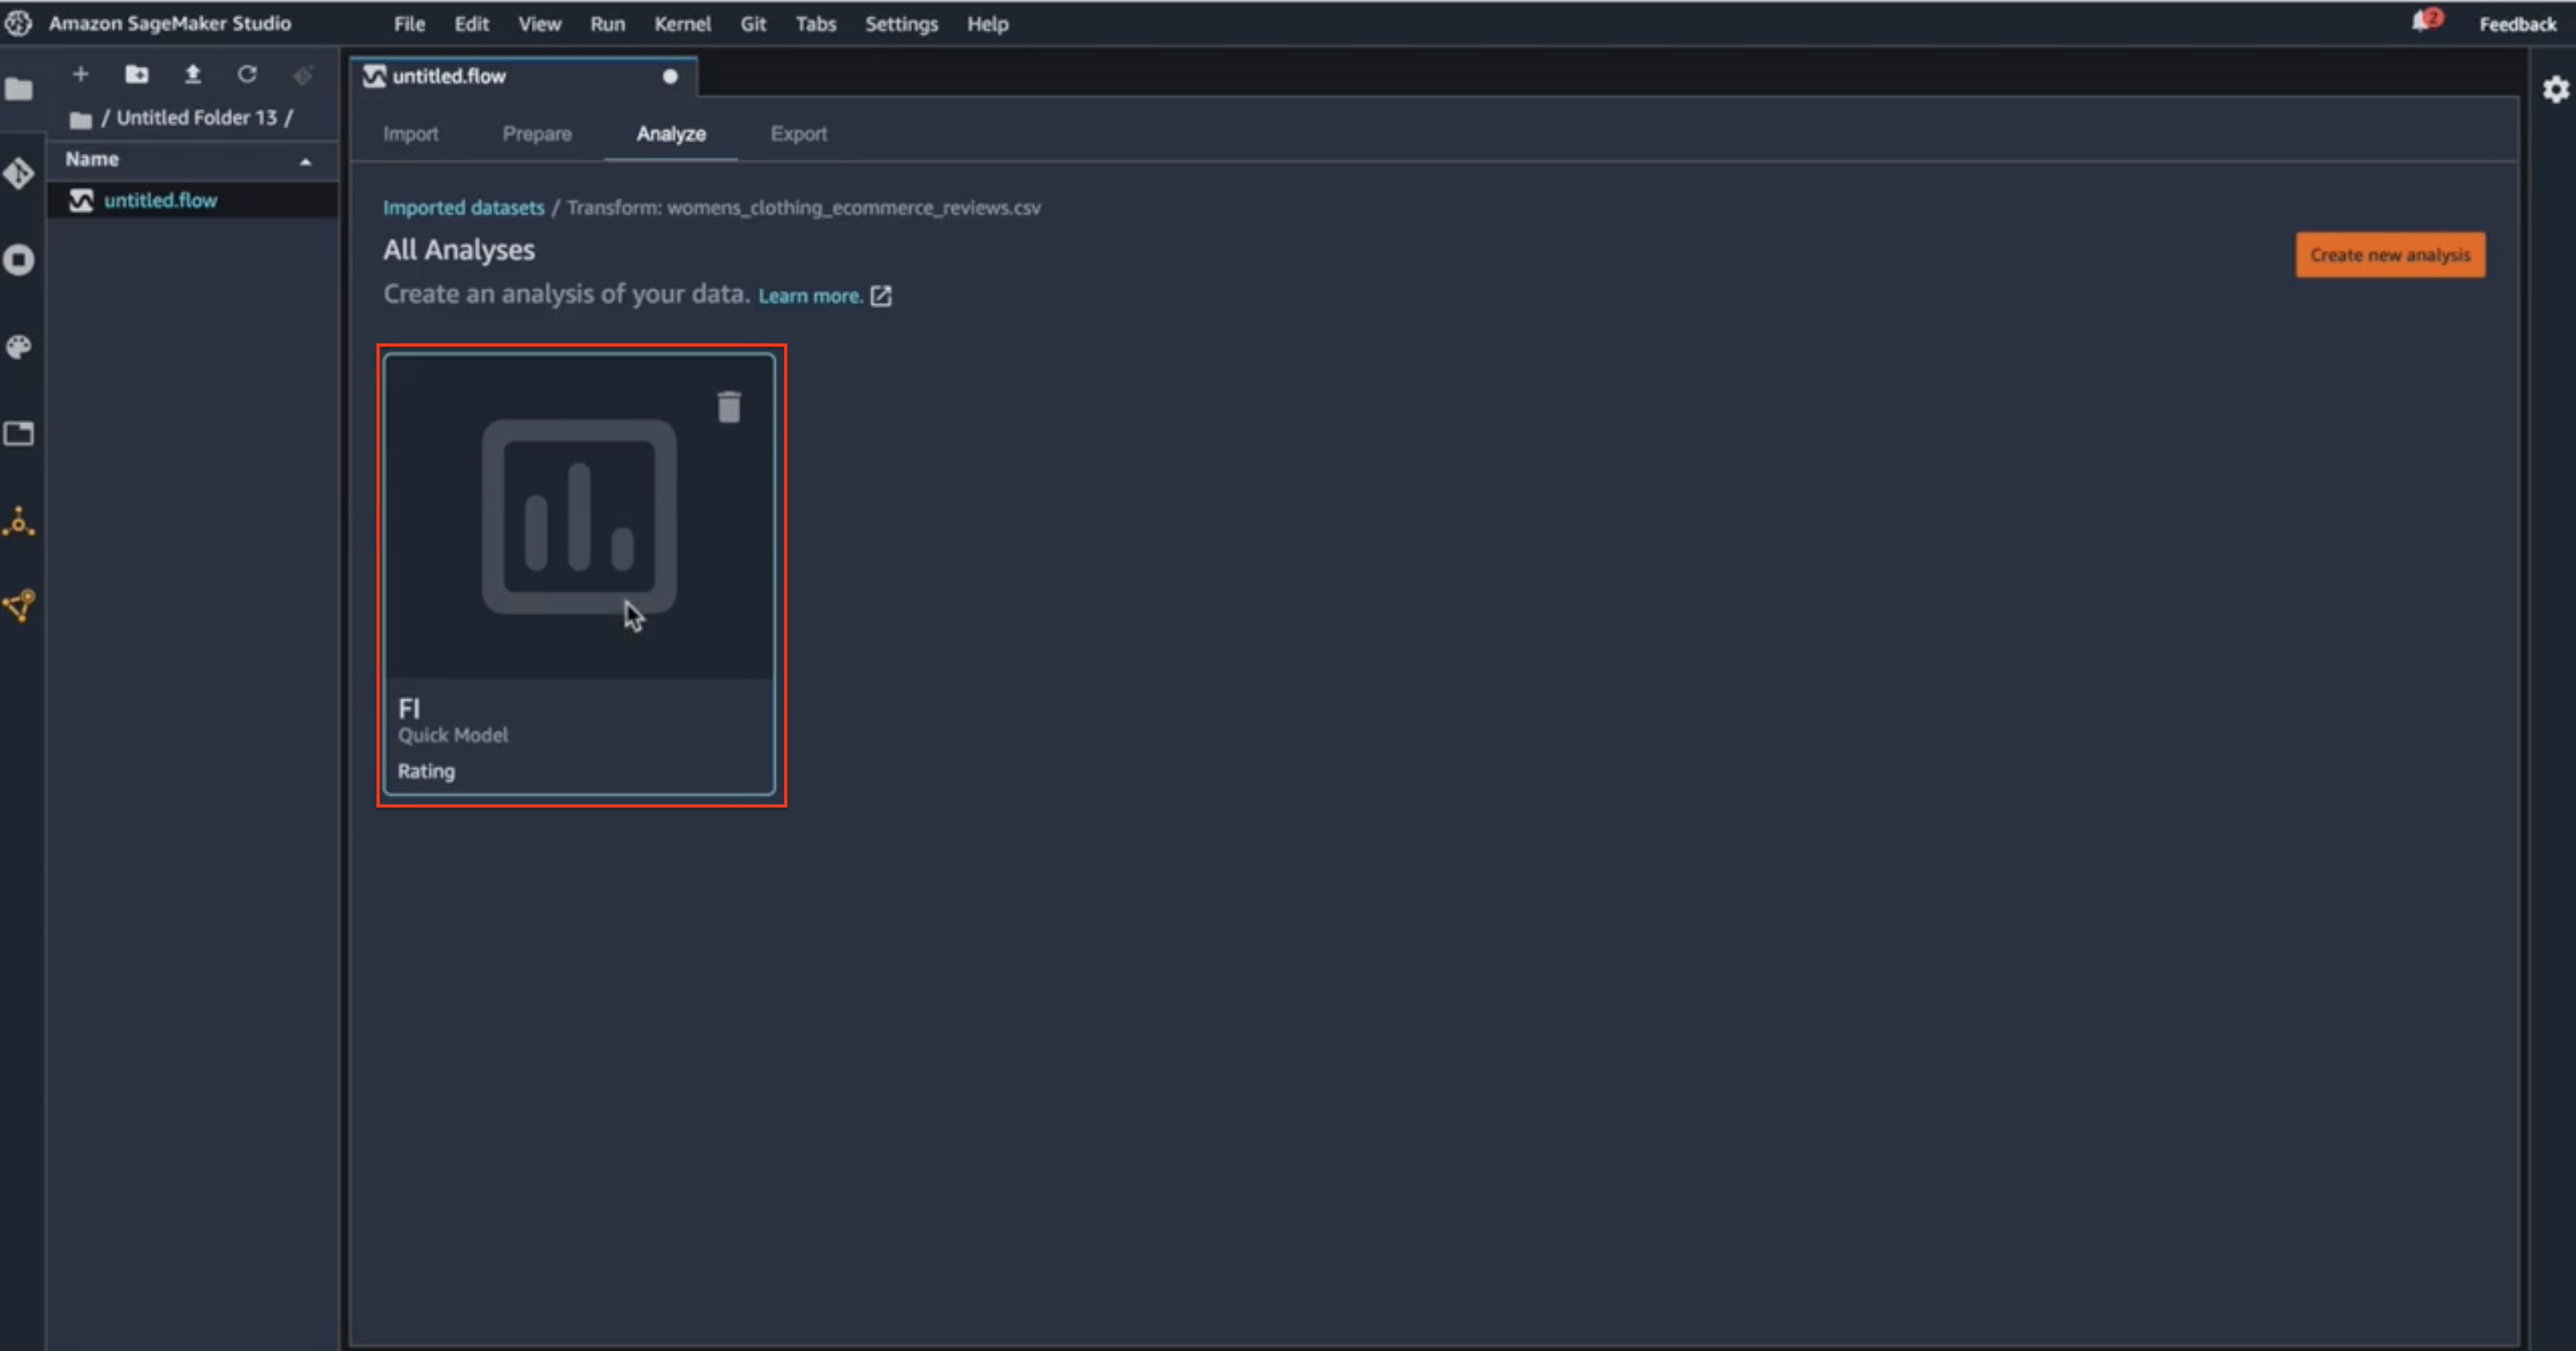
Access previous analysis
So, that’s it for this post. In the next ones, I’ll go through AutoML and some other cool stuff 😎